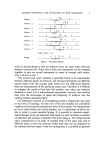
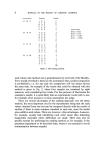
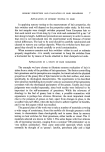
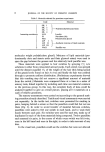
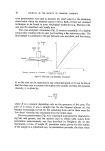
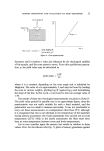
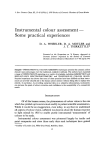
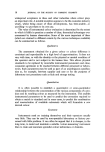
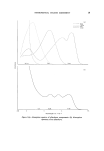
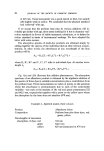
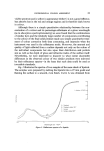
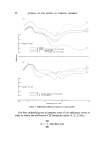
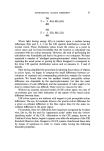
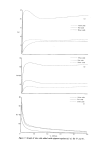
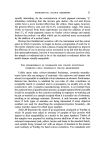
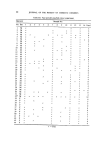
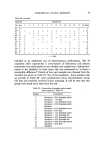
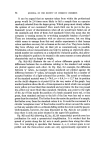
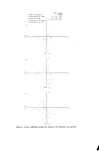
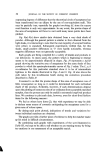
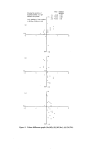
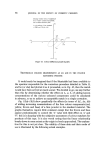
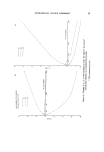
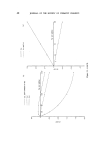
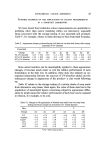
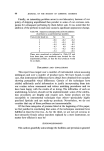
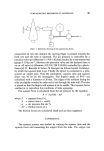
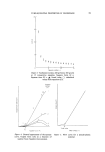
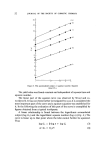
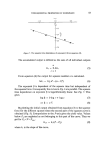
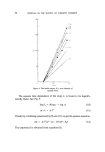
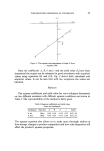
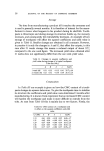
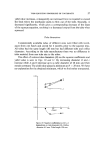
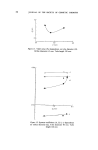
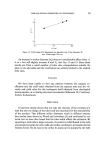
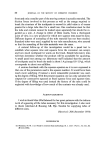
38 JOURNAL OF THE SOCIETY OF COSMETIC CHEMISTS -2 Showing tentative 'area of acceptance' for a medium coloured face powder, and a batch correction path L,a,b, readings of the standard L: 58.0, a: +9'5, b= + 16'1 I 5th t .---."•. ...... 2nd ,.-' 6,•? '"-½%-? -I A½ -I.6 Figure IO. Colour difference graph (Aa/Ab). TRISTIMULUS COLOUR MEASUREMENT AS AN AID IN THE COLOUR MATCHING PROCESS It could easily be imagined that if the Hunterlab had been available to the operator responsible for the correction procedure detailed in Table II, and he (or she) had plotted it as it proceeded, as in Fig. 10, then the match would have been arrived at much sooner. We decided to go one step further than this by determining whether the effect on L, a, b, of adding known concentrations of the various coloured components could be calculated in advance, so as to achieve an acceptable match in a single correction. Fig. 11(a)-ll(d) show graphically the effects (in terms of AL, zXa, Ab) of adding increasing concentrations of the four colour components (red, yellow, brown and base) of a face powder to the standard material. The graphs themselves require little comment except that the brown and base appear predominantly to control the 'L' value with little effect on 'a' and 'b': this is in keeping with the subjective assessment of colour matchers for products of this type. It is also worth noting that the linear relationship breaks down to some extent as the origin is closely approached. The explana- tion for this is not yet clear. The validity of these data and their mode of use is illustrated by the following actual examples.

INSTRUMENTAL COLOUR ASSESSMENT 39 i : , i • i - ! . 0 ,i / ! / q'o'7 V
Purchased for the exclusive use of nofirst nolast (unknown)
From: SCC Media Library & Resource Center (library.scconline.org)