HUMAN PATCH TESTING PROCEDURE 757 were applied to the patches, secured in place with the elasticized web, and allowed to remain in place until approximately 9:00 A.M. the following morning. The treatment areas were then rinsed with water and patted dry with paper towels. Subjects were not scored immediately for irritation, but returned in the early afternoon. This permitted the generalized hydration and wrinkling of the skin to subside before evaluating the ef- fect of treatments. Scoring was done using the criteria (4) in Table I, following which the treatments were reapplied to the same sites by the method previously described. This procedure was repeated for four consecutive days, except that treatments were not reapplied on the final day, Day 5. Treatments were discontinued on any site that exhibited an irritation score of six or greater during the test. STATISTICAL DESIGN AND ANALYSIS In the early stages of development an 8 x 8 Latin Square was used to assign treatments to subjects and sites. After some consideration, it was decided that a randomized blocks design was more appropriate. The Latin Square, unlike a randomized blocks design, permits separation of the sites and subjects effects from the treatments effect. The problem was that the sites effect thus isolated also contained the effect of the sub- jects x treatments interaction, which is the desired error term for the test of treatments when such an interaction exists. Indeed, in the early Latin Square designs the sites ef- fect fluctuated so widely that the only plausible explanation, since any differences among sites would be expected to remain fairly constant, was a varying contribution of the subjects x treatments interaction. This interaction may be described as the extent to which different subjects respond differently to the same treatment, i.e., one subject is highly irritated by treatment A, but finds treatment B only mildly so while another subject experiences the reverse situation. From a clinical viewpoint, this would not be a highly unusual event. The randomized blocks design which was used in the tests described herein, ran- domizes the effect of sites in an unbiased manner and permits the testing of the treat- ments effect against the subjects x treatments interaction. At the conclusion of any single irritation test, each subject had five recorded scores for each treatment: a score of zero representing the irritation level just before treatment and four scores representing the irritation response to treatment on four consecutive days. An analysis of the mean irritation score for the four treatment days is perhaps the most straightforward approach to comparing the irritancies of various treatments. Such a method is often illuminating and should be used in conjunction with information ob- tained from the method described below. A simple analysis of the mean irritation level may result in a loss of important information, however. For instance, consider the irri- tation scores of the following two hypothetical treatments: Irritation score for day # 1 2 3 4 5 Mean Treatment A: 0.0 3.0 3.0 3.0 3.0 2.4 Treatment B: 0.0 1.0 2.0 3.0 6.0 2.4 Treatment A results in a moderate level of irritation occurring fairly rapidly, but does not seem to worsen with repeated applications. Treatment B begins with fairly low irri- tation levels, but repeated applications produce increasingly higher irritation scores.

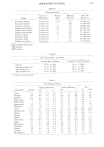
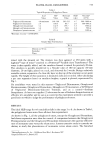
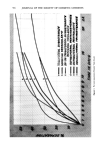
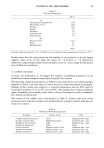
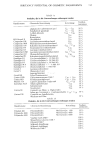
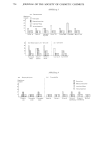
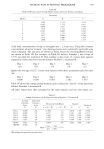
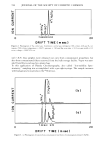
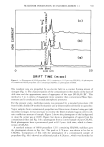
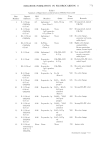
758 JOURNAL OF THE SOCIETY OF COSMETIC CHEMISTS The information contained in these scores is partially or totally lost by consideration of only the mean irritation score (means are the same for both treatments). Clearly, some method of assessing the rate of change in irritation would be useful. For instance, treat- ment B might be perfectly acceptable for a product intended for occasional use, whereas in chronic use situations it could prove much too irritating. A technique described in detail by Mandel (13) can be used on data of this type. Briefly, this technique involves linearizing the changes in daily irritation scores, by expressing them as a function of the average irritation score for all treatments on each day. In other words, rather than plotting the irritation scores versus time which would undoubtedly produce a nonlinear plot, the x-variable is represented instead by the mean irritation score at each time over a//of the treatments. The five individual scores for each treatment on each subject are then regressed upon these overall mean irritation scores, and the slope of the line becomes the response ß used in the analysis. A slope of 1.0 represents an exactly "average" treatment a slope greater than 1.0 represents a treatment more irritating than the average and a slope less than 1.0 represents a treatment less irritating than the average. RESULTS This testing and analysis method has been used extensively over the past year within our laboratory, principally in evaluating prototype formulations and competitive products. The data to follow have been selected from several different experiments to demonstrate the utility of the test in different situations. Tests indicated that mild shaving creams and soaps could be sensitively tested this way Table II Irritancy Scores of Two Shaving Creams (A & C) and a Mild Toilet Soap (B)-- All at 2.5 Per Cent Principal Irritant Level Subject 1 2 3 Day Treatment 1 2 3 4 5 1 2 3 4 5 1 2 3 4 5 A 0.0 2.0 2.0 2.0 3.0 0.0 0.5 0.5 1.0 2.0 0.0 0.0 1.0 2.0 0.5 B 0.0 0.0 1.0 2.0 2.0 0.0 0.0 1.0 2.0 2.0 0.0 0.0 0.5 3.0 3.0 C 0.0 1.0 2.0 2.0 2.0 0.0 0.5 0.0 0.5 0.0 0.0 0.0 0.0 0.0 1.0 Subject 4 5 6 Day Treatment 1 2 3 4 5 1 2 3 4 5 1 2 3 4 5 A B c Subject Day Treatment 0.0 0.0 2.0 2.0 2.0 0.0 0.0 0.0 0.0 1.0 0.0 0.5 1.0 2.0 2.0 0.0 1.0 1.0 3.0 2.0 0.0 0.0 0.5 1.0 1.0 0.0 0.5 1.0 2.0 2.0 0.0 0.0 0.0 0.5 1.0 0.0 0.0 0.0 0.0 0.5 0.0 0.5 1.0 0.0 1.0 7 8 9 1 2 3 4 5 1 2 3 4 5 ! 2 3 4 5 A 0.0 0.0 2.0 2.0 1.0 0.0 0.0 1.0 2.0 2.0 0.0 0.0 1.0 1.0 2.0 B 0.0 2.0 2.0 2.0 2.0 0.0 0.0 1.0 1.0 2.0 0.0 0.5 2.0 3.0 3.0 C 0.0 1.0 0.5 0.0 0.0 0.0 0.5 1.0 2.0 3.0 0.0 0.0 1.0 2.0 2.0
Purchased for the exclusive use of nofirst nolast (unknown)
From: SCC Media Library & Resource Center (library.scconline.org)