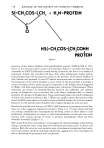
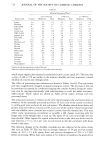
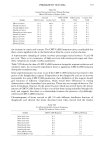
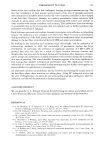
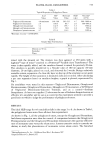
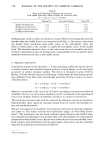
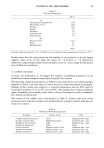
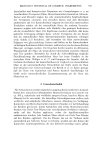
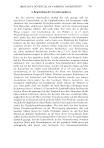
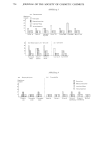
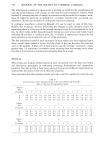
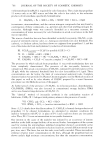
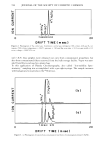
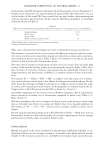
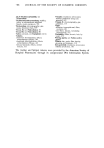
MALODOR FORMATION IN FLUOROCARBON 11 767 Samples were taken from the walls of the corroded lines and three other lines at the site. One of the three lines was also corroded. Both corroded lines contained brown deposits that were shown by X-ray diffraction/fluorescence to be mixtures of crystalline oxides, FeO/FeaO4/Fe2Oa, containing traces of other metals used in construction. The chloride analysis of deposits from both corroded lines was 12 per cent. In contrast, the deposits from the relatively uncorroded lines were amorphous, very hygroscopic, and had a chloride analysis of 28 to 30 per cent. This indicated that, under normal operation, some anhydrous FeCb/FeCla may form on the walls of propellent lines. Once gross amounts of water are introduced, the chlorides are hydrolyzed, releasing their HC1, via the following sequence: IX. 2FeC12 + 3H,,O-• FeO (hydrated) + Fe(OH),, + 4HC1 X. 4FeO--• FeaO4 q- Fe XI. 2Fe(OH),, q- 1/20,, --• Fe2Oa + 2H,,O (6) The HC1 released by this hydrolysis as well as from the reduction of propellent 11 is then removed by further corrosion processes at the metal surface. It is relevant at this point, that during these hydrolytic processes at the metal surface, more H20 is also being produced by reduction of nitromethane (Eq. V). METHODS A. IDENTIFICATION OF METHYL ISOCYANIDE PLASMA CHROMATOGRAPHY Plasma chromatography is a method developed for identification of trace materials in concentrations of 10 -6-10 -•ø v/v and below. The technique has been described in de- Gas Exit Heater • Jacket j F,,,i Diif7 IGa• I •-I.•... Reaction I Region•L:•:•z•. I r I,-I I(,/ Drift ! Electrometer • • • • • Tube / • I• • o• • etNi / ?ard• • • • •• Signal Ionizer •ngs•- • IT Averag Drift Gas Figure 1. Plasma chromatograph (ion drift spectrometer).

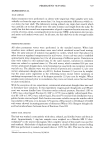
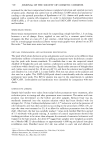
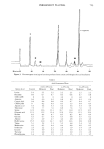
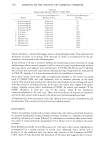
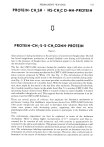
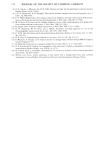
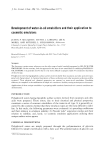
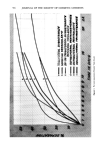
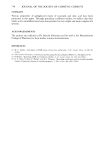
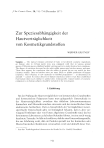
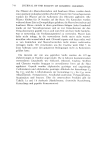
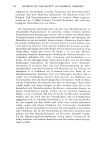
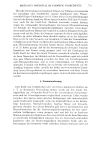
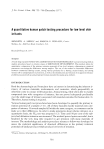
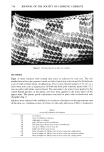
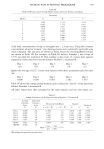
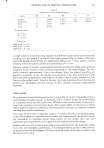
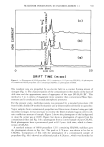
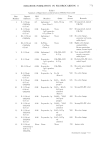
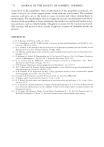
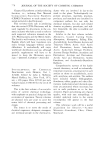
768 JOURNAL OF THE SOCIETY OF COSMETIC CHEMISTS I- z LIJ 13:: 13:: 0 Z 0 0 ?.os e.oo e.o4 20 DRIFT TI ME ( rn sec ) Figure 2. Plasmagram of N• carrier gas. Conditions: carrier gas (ultrapure) 100 cc/min drift gas N,• (ul- trapure) 500 cc/min temperature = 204øC pressure = 760 mm Hg scan time = 10.2 sec gate width = 0.2 rn sec voltage = 3000 V/14 cm. tail (7,8,9). Gas samples were obtained not only from contaminated propellant, but also from contaminated filters removed from the bulk storage facility. Vapor was sam- pled from filters enclosed in a plastic bag. In this application of Plasma Chromatography, also called "Ion-mobility Spec- trometry," sampling was accomplished with a gas tight syringe. The sample interacts with background ions produced by 6aNi/g-rays. I- z LIJ 13:: 13:: 0 Z 0 +. '--'-• I I ?.08 8.12 -f- -I- I 9.7o (b) (a) DRIFT TIME (rnsec) Figure 3. (a) Plasmagram of vapors from contaminated line filters (b) plasmagram of pure CHaNC.
Purchased for the exclusive use of nofirst nolast (unknown)
From: SCC Media Library & Resource Center (library.scconline.org)