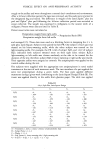
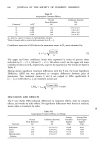
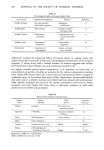
VEHICLE EFFECT ON ANTI-PERSPIRANT ACTIVITY 185 where Zjkmp = In(ratio) -- ln(Zmgtreated) - ln(Zmgcontrol) overall mean •k T•jkm bp •{•kp {•jkmp subject k, k = 1, 2, 3, 4 •3•k = 0 subject k, k = 1, 2, 3, 4 •3•k = 0 week m, m, = 1, 2, 3, 4 23'ym = 0 error (A) for treatment j, subject k, and week m • NID (0, tr, 2) side p, p = 1, 2 23•p = 0 treatment and sides interaction jp --• 23i(•b)i p = •3p(O/•)jp = 0 subject and sides interaction kp • •3k(•{•)k p = •3p(•{•)k p = 0 weeks and sides interaction mp • 23m('yt$)m p = •p(•/•)mp = 0 error (B) for treatment j, subject k, week m, side p • NID (0, tr, 2) The AOV is illustrated in Table V. Table V Analysis of Variance for 4 by 4, Split Plot, Latin Square Source of Variation DF SS MS F Test Treatments (A) 3 SS^ MS^ MS^/error (A) Subject Pairs (B) 3 SS. MS. MS./error (A) Weeks (C) 3 SSc MSc MSc/error (A) Sides (D) 1 SSD MSD MSD/error (B) Subjects x Sides (BD) 3 SS.on MS.on MS.on/error (B) Weeks x Sides (CD) 3 SScon MScon MScon/error (B) Treatment x Sides (AD) 3 SS^D MS^D MS^D/error (B) Pooled Residual 12 SSpR Error (A) 6 SSAB, MS error (A) Error (B) 6 SSAB D, MS error (B) Total 31 SS T The dependent variable used in this analysis was the logarithm of the sweat ratio calculated as z = In (•/•)= In ([y• + Y2 + Y3]/[x• + x2 + x3]) where • = mean perspiration weight (mg) of three daily collections on the treated side and • = the same for the control side. The post-test sweat ratios (Table III) were transformed to natural logarithms to simplify calculations, stabilize the variance, and maintain a normal distribution. The F test indicated the absence or presence of significant differences in the variables. The ratio of treat•rnent axilla to control axilla was estimated by In h i = •i, therefore R i = ej 2 where R i is the post-test treatment ratio mean and ii is the mean of the logarithm of sweat ratios for the jth treatment. The antilog of the geometric mean of the data from each treatment was calculated and subtracted from unity to obtain the percent sweat reduction of each treatment. (1 -- hi) X 100 = percent sweat reduction.

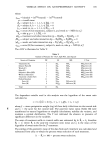
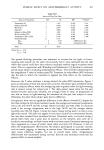
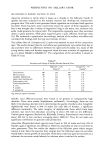
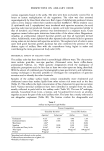
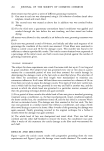
186 JOURNAL OF THE SOCIETY OF COSMETIC CHEMISTS Table VI Antiperspirant Treatment Efficacy Percent Confidence Intervals, Sweat Reduction 95%, Treatment a In •,•b (%) (%) A• 0.060 -6.2 -37.3 to 17.9 A 2 --0.382 31.8 11.8 to 47.2 A• --0.478 38.0 19.8 to 52.0 h 4 --0.391 32.4 12.5 to 47.7 aA•, stick h2, cream A3, lotion h4, hydroalcoholic solution. bRatio of treated axilla to control axilla estimated by In R• = E•. Confidence intervals of 95% about the t.reatment mean, In •j, were estimated by .•/error (A) •j + t6,.o 5 • • The upper and lower confidence limits were expressed in terms of percent sweat reduction by (1 - e u) x• 100 and (1 - e l) x 100 where u and 1 are the upper and lower confidence limits on In R i, respectively, as given by equation [1]. The results are listed in Table V. Having shown significant treatment differences with the F test, the Least Significant Difference (LSD) test was performed to compare differences between pairs of treatments. Two treatment means, •i and •i are judged to differ significantly if ]•i - •i[ LSD where zi, z i are treatment means and 2 (error (A)) _ 0.364 LSD95 = t6"ø5 8 - DISCUSSION AND RESULTS The F test (Table VIII) indicated differences in treatment effects, sides by subjects effects, and weeks by sides effects. No significant differences were found in subjects, weeks, sides or treatment by sides. Table VII Antiperspirant Treatment Efficacy and Dosage Treatment Average Average Dose Percent Confidence Intervals, Treatment Active Agent Sweat Reduction 95% Applied Applied (%) (%) (mg) (mg) Solid Stock Cream Lotion Hydroalcoholic Solution -6.2 - 37.3 to 17.9 143.04 69.16 31.8 11.8 to 47.2 379.96 75.99 38.0 19.8 to 52.0 172.76 34.55 32.4 12.5 to 47.7 263.52 52.70
Purchased for the exclusive use of nofirst nolast (unknown)
From: SCC Media Library & Resource Center (library.scconline.org)