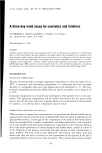
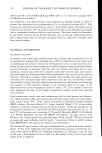
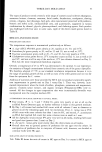
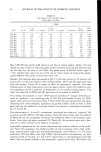
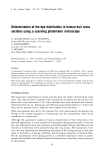
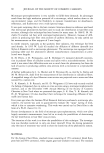
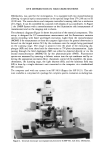
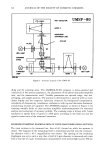
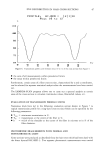
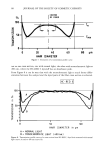
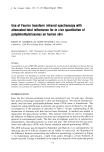
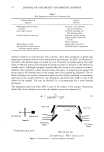
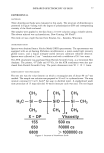
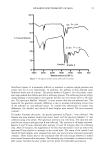
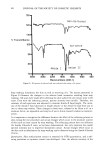
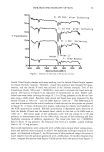
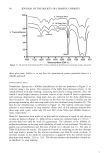
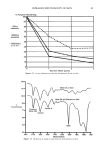
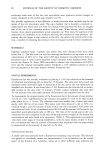
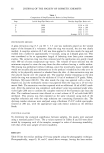
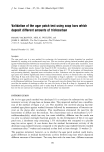
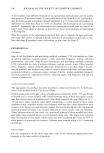
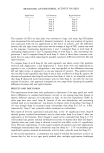
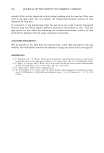
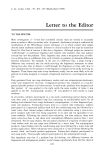
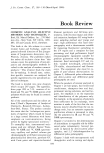
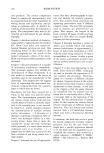
64 JOURNAL OF THE SOCIETY OF COSMETIC CHEMISTS PMT-DETECTOR UMSP-80 IdONO II FILTER MEASURING DIAPHRAGM (MF) OCULAR HBO-LAMP SCANNING STAGE TUNGSTEN M1 XBO-LAMP LAMP SH IF' MONO I SH UM• W Figure 3. Schematic diagram of the UMSP 80. dling and for scanning areas. The LAMBDA-SCAN program is menu-operated and controls all of the system parameters, the adjustment of the photo-multiplier/amplifier unit, and the measurement itself. Variable parameters are spectral range, step size, averaging, and sample position. The position is determined by a joystick with x,y-coor- dinate display and the computer. Spectrum correction for background compensation, calculation of chromaticity coordinates, arithmetics with log and derivative formation, and plotting routines are supplied. The APAMOS program, as shown in Figure 4, for scanning variable fields of cross sections simplifies multimeasurement for statistical analysis and evaluation of intensity profiles. The scanning stage is driven with ¬-ptm resolution at speeds from 25 ptm/s to 2500 ptm/s according to the field size and the signal-to-noise ratio of the measured intensities. MICROPHOTOMETRIC EXAMINATION OF DYED HAIR FIBER CROSS SECTIONS The cross sections to be measured are, first of all, focused on while the aperture is closed. The diagonal of the measuring field is determined and fed into the computer. An objective with a 16 X magnification was chosen. The opening of the measuring diaphragm was set in such a way that a field of 4-p•m diameter is measured each time with a step size of 2 ptm. Transmission measurements with normal light and at 490 nm

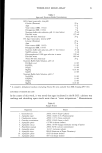
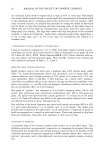
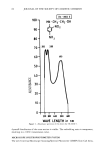
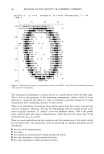
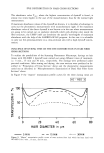
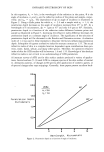
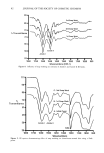
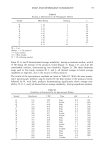
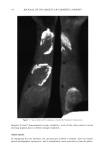
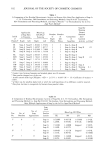
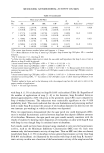
DYE DISTRIBUTION IN HAIR CROSS SECTIONS 65 Y START END Figure 4. APAMOS program for scanning fiber cross sections. x at which the HC-RED 3 dyestuff has a maximum absorbance (see Figure 1) were carried out. For each step size the transmission value is stored in the computer. The system is calibrated so that a signal of 100% - 3% transmission is measured for the embedding resin, surrounding the dyed hair fiber cross sections. Twenty cross sections were mea- sured from each sample at random. Figure 5 shows a typical printout for one hair fiber cross section. The thresholds have been set between 70% and 95% transmission. Transmission values below 70% are printed as a dark block. The printed numbers multiplied by 10 correspond to the transmission values within the indicated region (70% --: 95% transmission). 100% transmission values have been suppressed and there is therefore no printout. While the printout as shown in Figure 5 gives only a visual impression of the dye distribution in the cross section, the profile evaluation as carried out by the computer is very suitable for a quantitative evaluation (Figure 6). Because of the fact that all trans- mission values are stored in the computer with an accuracy of one tenth of a unit, the profile evaluation is only carried out with the help of the APAMOS-program (Auto- matic Photometric Analysis of Microscopic Objects by Scanning). In the case of Figure 6 the mean values for rows 10 to 12 (y-direction) are calculated and drawn over the measuring axis in microns in the x-direction. It can be seen in Figure 6 for the selected cross section that a typical ring-type dyeing exists. Low transmission values at the outer parts of the fiber indicate a high dye concentration, while a large part of the interior has a 100% transmission, i.e. no dyestuff at all. The so-called ring-type dyeing is typical for short dyeing times.
Purchased for the exclusive use of nofirst nolast (unknown)
From: SCC Media Library & Resource Center (library.scconline.org)