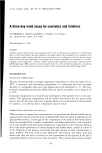
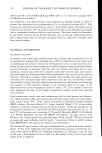
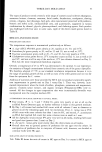
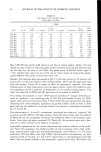
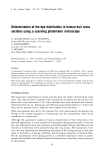
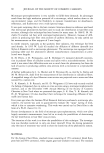
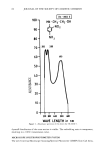
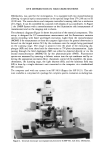
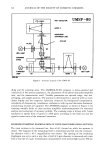
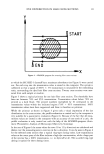
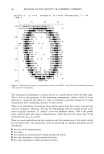
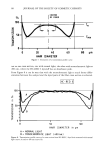
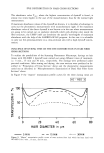
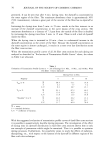
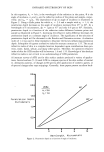
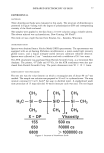
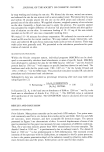
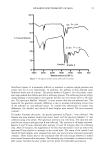
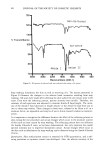
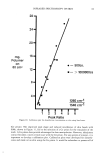
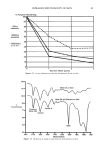
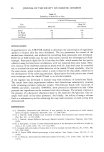
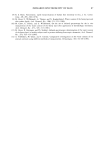
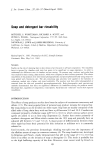
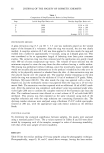
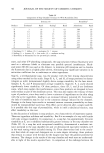
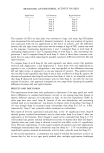
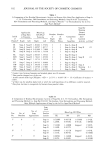
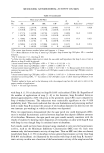
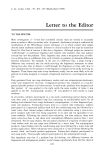
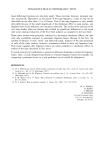
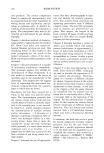
INFRARED SPECTROSCOPY OF SKIN 81 150 - 140 - 130- % Transmittance 120- 110- 100- 90 3800 3000 2200 1800 1400 1000 Wavenumbers (CM-1) Figure 7. Influence of softening on IR spectra intensity. D. 20 H•n. After Softening n•ng ^.•,•,• v" Am•de TT Amide I ' ! i i I I I 800 Amide I band height changes with soap washing, but the Amide II band height appears to remain relatively constant. Therefore, a band ratio approach was evaluated for quan- titation, and the Amide II band was selected as the internal standard. Two of the dimethicone fluids, 500cs and 1000000cs, were used to evaluate the band ratio ap- proach. The spectra in Figure 9 are indicative of dimethicones on skin. Twelve indi- vidual runs were made covering the range of 1.5 to 26 mg polymer on the 80 cm 2 test area using a ZnSe prism. Baselines were drawn and band areas were measured for the Amide II band at 1540 cm-• and the SiMe band at 1260 cm-•. The SiMe/Amide II ratio was determined for the initial condition of each run and the data points are plotted in Figure 10. A linear calibration plot results, indicating the validity and reliability of the ATR quantitation method. Reliable quantitation is dependent upon detection of both the Amide II band and the sample band, which in this case is the SiMe band at 1260 cm -• The linear range of the calibration curve will not always be to 26 mg polymer, as demonstrated here for the 500cs fluid, because of skin softening and film flexibility variations of different ingredients. The linear plot limit for 1000000cs fluid is about 15 mg polymer. To minimize dose level as a variable, a good working limit is 10-12 mg polymer. Our initial experiments were conducted with a ZnSe prism during which various proce- dures and methods were evaluated to achieve the optimized techniques reported in this paper. As illustrated in Figure 5, the IR spectrum of skin produced using a Ge prism is much simpler than the spectrum generated with a ZnSe prism. To further illustrate this point, compare the spectra from Figure 9 (ZnSe prism) with the spectra from Figure 11

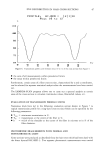
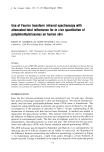
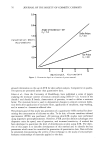
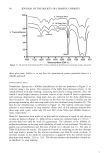
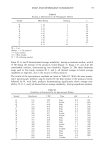
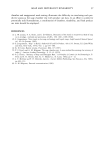
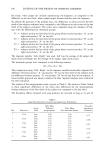
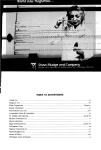
82 JOURNAL OF THE SOCIETY OF COSMETIC CHEMISTS 93- 85- 79- % Transmittance 72- 66- 59- 53 ell Amide I 3rd Soap Wash I ! I I I I I I I 1150 1050 950 1850 1750 1650 1550 1450 1350 1250 Wavenumbers (CM-1) Figure 8. Influence of soap washing on intensity of Amide I and Amide II IR bands. 111 ß 98- 86- % 73= Transmittance 61- 48= 36- C. 3rd Soap Wash B. 1st Soap Wash A. Initial Cond. Amide I Amide II SiMe 28- 1850 17'50 16•0 15•0 14'50 13'50 12'50 11'50 lg50 Wavenumbers Figure 9. IR spectra demonstrating effect of soap washing on dimethicone-treated skin using a ZnSe prism.
Purchased for the exclusive use of nofirst nolast (unknown)
From: SCC Media Library & Resource Center (library.scconline.org)