j. Soc. Cosmet. Chem., 37, 105-107 (March/April 1986) Letter to the Editor TO THE EDITOR: Most investigators (1-3) feel that controlled clinical trials are needed to accurately assess a product's affect on axillary odor. In general, deodorancy testing is conducted by modification of the Whitehouse-Carter technique (1) in which trained odor judges directly assess underarm malodor. Inherent in clinical studies of this type are numerous biases (4). One bias of concern is that due to fragrance. Although judges are trained to "sniff-through" or underscore fragrance and evaluate only malodor, they may subcon- sciously key into the perfume. Thus, fragrance may create a recognition bias, an affec- rive or liking bias or a difference bias, each of which can enhance or diminish differences between treatments. For example, in the case of a difference bias, a judge noting a difference may routinely rate the axilla receiving the fragranced treatment as either having less odor (due to failure to sniff-through the fragrance) or more odor (due to over-compensation for the presence of the fragrance) compared to the axilla receiving no fragrance. These biases may exist in any deodorancy study, but are most likely to be the greatest in studies designed to compare a fragranced material to a non-fragranced mate- rial. Data generated from two soap deodorancy studies and one antiperspirant-deodorancy study were analyzed for this bias. A fragranced product was compared to a non-fra- granced placebo product in all three studies. In each study, products were assigned such that product "A" was applied to the right axilla the same number of times it was applied to the left. Consequently, product "B" was applied to both axillae in equal numbers. In all studies, subjects participated in a two-week conditioning period during which time they used a non-perfumed soap bar containing no antimicrobial active for all bathing and refrained from using deodorants, antiperspirants, or other fragranced per- sonal care products. Twenty-four hours prior to a control odor evaluation, subjects participated in a supervised axillary wash with the conditioning soap bar followed by a water rinse. Four trained judges conducted all odor evaluations using a zero-to-ten- point category scale with zero being equivalent to no odor and ten equivalent to ex- treme malodor. Following the control odor evaluation, low odor subjects, those with mean scores less than 2, and those with contralateral differences greater than 1 were eliminated. For the soap studies, the test period consisted of a regimen of timed super- vised washes with the test soaps each followed by a water rinse. For antiperspirant products, timed washes with the conditioning soap were followed by a water rinse and product application. Odor evaluations were conducted at 12 and 24 hours following the second, third, and fourth product application. Twenty-four subjects participated in each soap study. Twenty-eight subjects participated in the antiperspirant study. Our hypothesis was that if a perfume bias did develop, the difference between the fragranced and unfragranced product would change significantly from the first third of 105

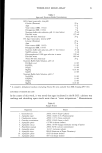
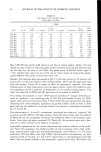
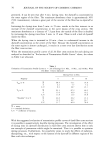
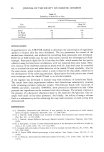
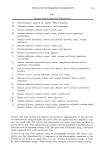
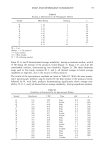
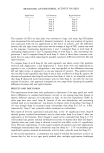
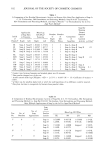
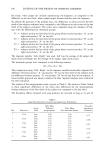
106 JOURNAL OF THE SOCIETY OF COSMETIC CHEMISTS the study, when judges are initially experiencing the fragrance, as compared to the difference in the last third, when judges might become familiar with the fragrance. To address the question of the perfume bias, the differences in odor scores for the first third of the subjects evaluated were compared to the differences in odor scores of the last third of the subjects evaluated. The scores were compared using the Analysis of Vari- ance with the following four treatment groups: T1 = subjects within the first third of the group which received product "A" on the right and product "B" on the left. T2 = subjects within the first third of the group which received product "B" on the right and product "A" on the left. T3 = subjects within the last third 6f the group which received product "A" on the right and product "B" on the left. T4 = subjects within the last third of the group which received product "B" on the right and product "A" on the left. The response variable "Left-Right" was used. Left was the average of all judges' left axilla scores and Right was the average of all judges' right axilla scores. The treatment groups were compared in the following manner: (T 1-T2)-(T3-T4) This comparison using "Left-Right" as the response variable statistically compared the difference between product "A" and product "B" for the first third of the subjects with the difference between product "A" and product "B" for the last third of the subjects. A linear models approach was taken to analyze the data. Separate analyses were conducted for each evaluation. The analysis of the antiperspirant study is given in Table I. The results in Table I failed to show significant differences in the mean odor differences for the antiperspirants during evaluation of the first third of the subjects as compared to the last third. The deodorant effects obtained with soap products for intervals as long as 12 and 24 Table I Judge Bias Descriptive Statistics and Significance Probabilities Odor Mean Two-sided Group Perfumed Odor Mean Significance Day Evaluation Third Antiperspirant Non-Perfumed Placebo Probability 1 12 hr First 2.28 5.04 0.37 Last 2.82 5.98 l 24 hr First 2.18 4.37 0.88 Last 3.54 5.63 2 12 hr First 1.94 5.30 Last 2.94 6.11 0.87 2 24 hr First 2.13 5.26 0.36 Last 3.43 5.70 3 12 hr First 1.96 5.59 Last 2.93 6.24 0.78 3 24 hr First 2.37 5.50 Last 4.09 6.33 0.45
Purchased for the exclusive use of nofirst nolast (unknown)
From: SCC Media Library & Resource Center (library.scconline.org)