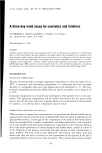
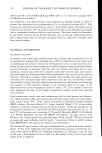
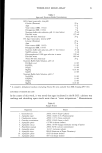
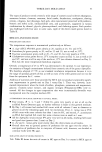
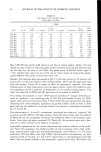
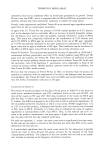
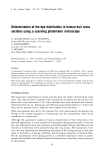
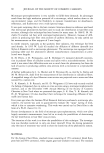
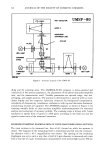
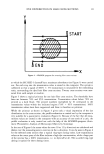
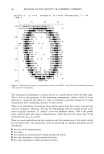
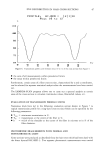
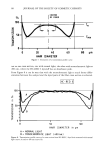
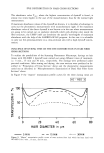
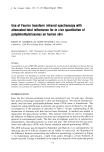
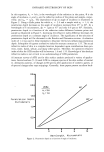
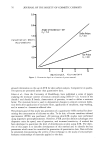
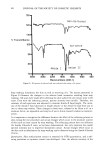
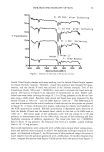
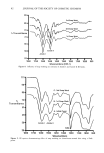
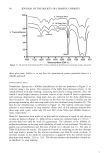
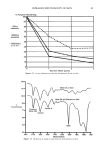
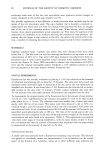
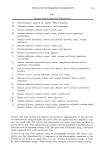
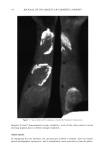
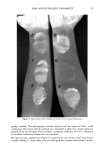
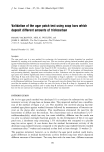
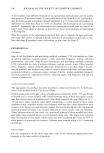
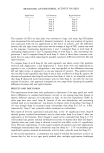
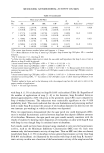
INFRARED SPECTROSCOPY OF SKIN 79 130 = 110 - 90.. % Transmittance 70- 50- 30- ZnSe Pt'ism Amide Amidell 10 , , , • ! •1 3800 3000 2200 1800 1400 1000 800 Wavenumbers (CM-1) Figure 5. IR spectra of skin using ZnSe and Ge prisms. Skin/Prism Contact. It is extremely difficult to maintain a constant sample pressure and surface area for in vivo experiments. In addition, the softness of skin depends upon hydration levels and oil content. The spectra shown in Figure 6, for a Ge prism, repre- sent soap-washed skin before and after a softening process. The softening process simply means holding a water-soaked towel against the skin for one minute prior to IR anal- ysis. The spectrum labelled "softened" is more intense than the non-softened case. The reason for the spectrum intensity difference is due to increased skin/prism contact area of the softened vs. non-softened states. To confirm this observation of contact area differences, the Amide I and Amide II band heights were ratioed. The ratio remained constant. To further illustrate this point, the spectra presented in Figure 7 were collected. The forearm was soap washed, rinsed with water, dried, and the spectrum labelled "A" was collected using a Ge prism. The spectrum intensity was very weak. The skin was soft- ened for one minute and spectrum B was collected. The intensity of all bands increased. Spectra C and D were collected after waiting 10 and 20 minutes after the softening step. After 20 minutes, the suppleness of the skin had decreased to such an extent that spectrum D was similar in intensity to the initial state. The ratios of the Amide I and Amide II band heights were measured for each case and all ratios remained essentially constant. These results lead to the conclusion that the only change observed is surface area contact between skin and prism. The softening step is necessary to maintain accept- able contact between the skin surface and the prism for repeatable quantitation.

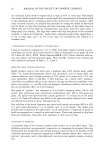
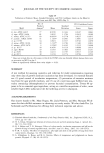
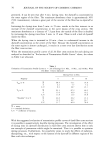
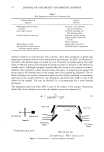
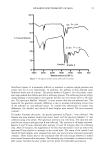
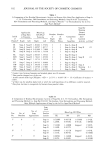
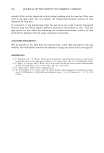
80 JOURNAL OF THE SOCIETY OF COSMETIC CHEMISTS 130 - 120- 110= Transmittance 100= 90- 80- Non-Softened Amide I Softened Amide II 70, ß ß ß i i i 3800 3000 2200 1800 1400 1000 800 Wavenumbers (CM-1) Figure 6. IR spectra of softened and non-softened skin using a Ge prism. Soap washing dehydrates the skin as well as removing oils. The spectra presented in Figure 8 illustrate the changes in the relative band intensities resulting from soap washing. All scans were made after softening the skin surface for one minute prior to IR scans. Even with the softening process, spectra intensity was variable. Therefore, the intensity of each spectrum was adjusted to constant Amide II band height. The inten- sity of the Amide I band decreases in height relative to the Amide II band from one to two to three soap washes. These changes in band ratio, referred to by Gloor eta/. as a moisture factor, are repeatable and may be of use in future research studies on moisturi- zation. It is important to recognize the difference between the effect of the softening process on skin during the test procedure and actual changes which occur in the moisture content of skin such as those caused by soap washing. The softening process does not influence the Amide I/Amide II ratio, as has been demonstrated, but only improves the overall spectral intensity due to improved skin/prism contact. Actual changes which occur in the skin such as dehydration by soap washing can be observed using the Amide I/Amide II ratio. Quantitation. Skin surface/prism contact is essential for ATR quantitation, and a soft- ening procedure to optimize contact was developed. Also, the relative intensity of the
Purchased for the exclusive use of nofirst nolast (unknown)
From: SCC Media Library & Resource Center (library.scconline.org)