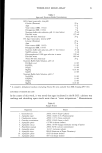
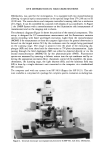
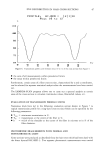
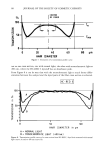
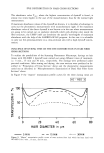
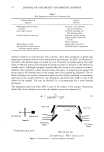
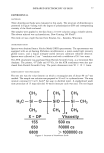
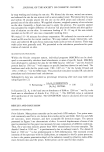
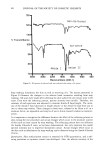
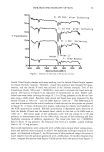
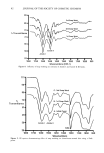
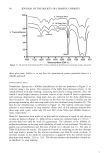
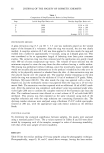
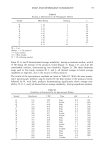
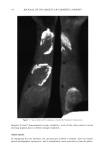
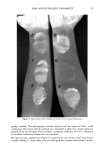
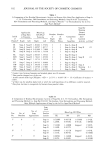
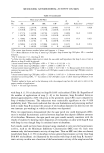
MEASURING ANTIMICROBIAL ACTIVITY ON SKIN 101 Application Left Forearm Right Forearm 1 Soap A Soap B 2 Soap B Soap A 3 Soap A Soap C 4 Soap C Soap A 5 Soap B Soap C 6 Soap C Soap B The number of CFUs on each plate was converted to logs, and mean log CFUs/plate were determined for each panelist's forearm (treatment). A one-way analysis of variance was conducted with the six applications as the factor of interest, and the difference between left and right scores (each score was the average of logs of CFU counts) was used as the response. Contrasting Applications 1 and 2 compared Soap A with Soap B, contrasting Applications 3 and 4 compared Soap A with Soap C, and contrasting Ap- plications 5 and 6 compared Soap B with Soap C. Each of these three contrasts com- pared the two soaps while adjusting for possible consistent differences between left and right forearms. To compare Soap A with Soap B, the same approach was taken, except that panelists received only Application 1 and Application 2. Since there were two applications as opposed to six, a Student's independent t-test was applied to the differences between left and right scores, as opposed to a one-way analysis of variance. This analysis tested the one-sided null hypothesis that Soap A was at least as effective as Soap B, against the alternative hypothesis that Soap B was better than Soap A, that is, we intended to show that Soap B deposited more bacteriostatic activity than Soap A. As with the one-way analysis of variance, this approach compared the two soaps while adjusting for possible differences between left and right forearms. RESULTS AND DISCUSSION The experiments shown here were performed to determine if the agar patch test could detect differences in residual bacteriostatic activity in vivo among soap bars known to deposit different amounts of triclocarban on skin. In the first experiment (Table I), three soap bars were used. Soap B, because of the new formulation and processing method used in its manufacture, was known to deposit more triclocarban than Soap A (3) even though Soap A contained more triclocarban than Soap B (1.5% vs. 0.8%, respectively). Soap C was a placebo which contained no triclocarban. The results of the first experiment indicated that, at the .01 significance level, Soap B showed greater residual bacteriostatic activity than either Soap A or Soap C after one application to the forearms. Even though it could not be concluded that Soap A (1.5% triclocarban) had greater residual antibacterial activity on human skin than did Soap C (placebo) after one wash, Soap A showed a trend for this effect at the 0.1 significance level. Previous experiments (1) with larger numbers of panelists and more applications (washings) demonstrated that a deodorant soap bar (Soap A--1.5% triclocarban) gave significantly greater residual bacteriostatic activity than a placebo soap bar (Soap C). In the second experiment, a comparison was made of residual bacteriostatic activity on human skin by the in vivo agar patch method after multiple applications (washings)

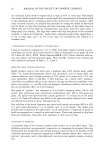
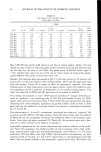
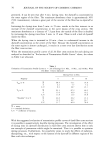
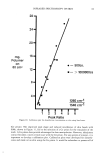
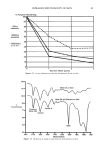
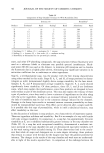
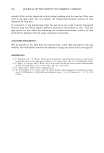
102 JOURNAL OF THE SOCIETY OF COSMETIC CHEMISTS Table I A Comparison of the Residual Bacteriostatic Activity on Human Skin After One Application of Soap A (1.5% Triclocarban, Old Formulation and Processing Method), Soap B (0.8% Triclocarban, New Formulation and Processing Method), and Soap C (Placebo--no Triclocarban) by the In Vivo Agar Patch Method a Application Mean Log of Soap Bars CFU/Plate c Number Number Initial to Forearms Forearms of of Comparison of Right Left of Panelist b Right Left Right Left Plates Plates Soap Bars Soap Bar Showing Greater Residual Anti- bacterial Activity p-Value a SE Soap A Soap B 1.82402 1.57654 3 JE Soap A Soap B 1.66507 1.82717 3 JH Soap B Soap A 0.91606 1.71800 3 RL Soap B Soap A 0.62764 1.74558 2 e RC Soap C Soap B 2.06165 1.39524 3 MH Soap C Soap B 1.70442 1.05399 3 KS Soap B Soap C 1.34734 1.54516 3 RT Soap C Soap A 2.04745 1.64869 3 CW Soap C Soap A 1.99246 1.51059 3 WF Soap A Soap C 2.29769 2. 17882 3 PW Soap A Soap C 1.82713 1.83259 3 3 Soap A-Soap B 3 Soap A-Soap B Soap B 3 Soap A-Soap B 3 Soap A-Soap B 3 Soap B-Soap C 3 Soap B-Soap C Soap B 3 Soap B-Soap C 3 Soap A-Soap C 2 e Soap A-Soap C Soap A 3 Soap A-Soap C Showing 3 Soap A-Soap C Trend .01 .01 0.1 a Contact time between forearms and streaked plates was 30 minutes. b One panelist dropped out of the test. c Actual control mean log CFU/plate -+SD = 2.6174 _+ 0.0957 (N = 15). Coefficient of variance = 3.66%. d p-Value was the smallest alpha level at which the null hypothesis of no difference could be rejected. • One plate lost due to overgrowth by bacteria from panelist's skin. Table II A Comparison of Residual Bacteriostatic Activity of Soap Bar A (1.5% Triclocarban, Old Formulation and Processing Method) vs. Soap Bar B (0.8% Triclocarban, New Formulation and Processing Method) After Multiple Applications of Soap by the In Vivo Agar Patch Method • Soap Used No. of Mean Log CFU/Plate Test No. of Soap Panelist No. Panelists Applications Initials RL PF JH RB Soap A 1.6328R i 0.9673R 1.6559R 1.4742L Soap B 1.2280L 0.6918L 0.9612L 1.4804R Soap A 1.5419R 1.4288R dropped 1.5907L Soap B 1.3428L 0.8157L 0.7934R Soap A 1.8584R 1.4272R dropped 1.0454L Soap B 1.1115L 0.8674L 0.9108R Soap A 1.9985R 1.3368R dropped 0.2817L Soap B 1. 1625L 0.6930L 0.3010R
Purchased for the exclusive use of nofirst nolast (unknown)
From: SCC Media Library & Resource Center (library.scconline.org)