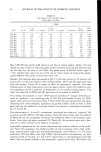
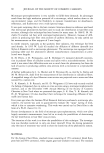
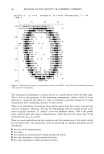
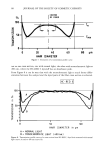
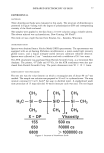
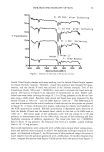
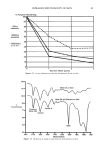
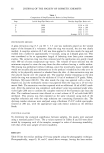
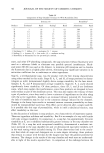
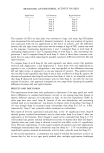
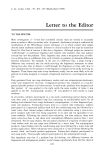
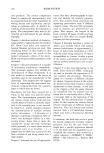
66 JOURNAL OF THE SOCIETY OF COSMETIC CHEMISTS HC--RED 3 12:l•A1 Intensity [%] with Thresholds: •0 /95 [--'AGE I 051 : 998•,899 : 98•B889 9 :99 98•8999 ,, 2o I I ,, ,, I 251 ,, U 1 o 2 0 30 I ............... I .......... I -I .... EI77888899998888889888999 9 9998•'77888877•89 998•7789999999887•8999 998•89 998•7899 9 998•999 9•87•799 9 9 9 9887•99 998'7•899 998•79 998•899 9987•79 9 988•'799 9988•8999 9 9988•899 9988•899 9987•899 997•899 987•'7999 987•BB8 98BB789 98•899 9 98•7•89 98•/899 9 87•'799 9 9 87•7999 98•789 9 9 9 8•899 9•89999 998/•'7899 9 9 98•899 9 9 99•778999 999987•899 97•7888988887•8 9 997•7•7•88 9 987•77899 9 9999 99 Figure 5. Photometer printout of transmission values of HC-RED 3 dyed fiber with thresholds between 70% and 95% transmission. The maximum of absorbance is always located at a small distance from the fiber edge. This is due to the geometry of the measuring arrangement, where a field of 4 }zm diameter is measured (see above) so that in scanning a gradual changeover in light transmission from embedding medium to fiber occurs. There is the possibility of averaging these profile curves f¾om the twenty cross sections with the computer. However, this has the disadvantage that the average profile curve loses its typical character. A "master" curve was therefore chosen. This is the profile curve, selected from the twenty measurements, which best fits the mean value of the evaluated data Tmin, T m and b. There are more possibilities for the evaluation and the presentation of the results which are not shown here. The possibility exists of producing an intensity histogram and of calculating: © the sum of all measurements © the mean © the number of measurements within preselected limits © the total absorbance within preselected limits © the mean absorbance within preselected limits

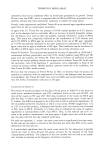
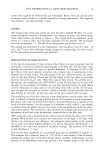
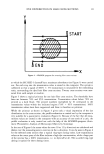
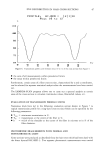
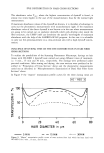
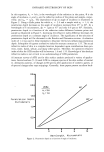
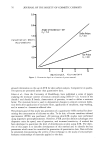
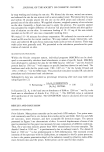
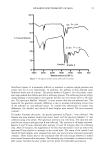
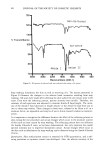
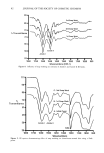
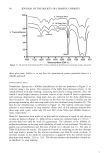
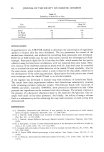
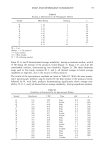
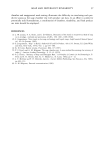
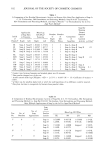
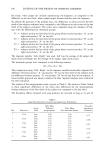
DYE DISTRIBUTION IN HAIR CROSS SECTIONS 67 BO i it" t' E ,B ---- rny' Figure 6. Transmission profile curve between rows 10 to 12 of the cross section from Figure 5. © the sum of all measurements within preselected limits © the mean within preselected limits Furthermore, certain areas of a fiber cross section, characterized by x and y coordinates, can be selected for separate statistical analysis after the measurements have been carried out. The LAMBDA-SCAN program allows one to carry out a spectral analysis at certain areas of the cross section to calculate tristimulus values, Hunterlab values, etc. EVALUATION OF TRANSMISSION PROFILE CURVES Numerous trials have led to the following evaluation system shown in Figure 7 (a typical transmission profile for a ring-dyed cross section) which can be specified by the following parameters: ß Tmi n = minimum transmission in %. ß T m = transmission at the centre of the fiber in %. © b = width of the shoulder at the centre of the fiber in microns or in % of the fiber diameter. PHOTOMETRIC MEASUREMENTS WITH NORMAL AND MONOCHROMATIC LIGHT Cross sections were produced as described from the hair tress which had been dyed with the direct dyestuff HC-RED 3. Two separate photometric measurements were carried
Purchased for the exclusive use of nofirst nolast (unknown)
From: SCC Media Library & Resource Center (library.scconline.org)