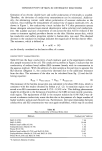
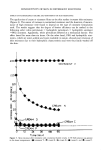
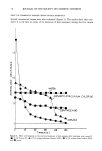
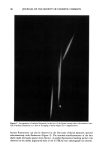
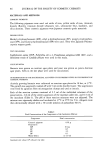
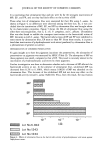
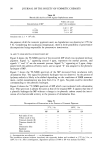
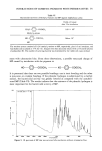
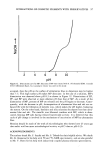
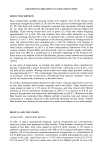
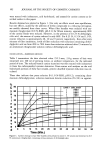
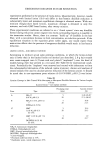
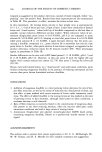
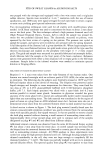
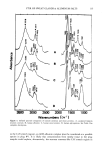
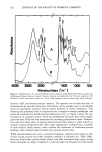
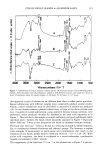
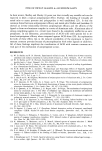
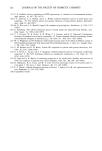
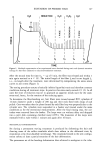
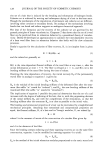
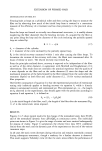
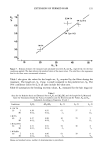
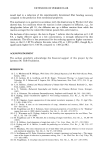
120 JOURNAL OF THE SOCIETY OF COSMETIC CHEMISTS I ' I ' ' I • I I A B 4000 3500 3000 1500 1000 5OO Wavenumbers {CM '1 ) Figure 6. Infrared spectra: A, antteated forearm stratum cornearn, prehydrated for 68 hours and dried. B, ACH-treated forearm stratum corneurn. Stratum corneum was prehydrated for 90 hours, soaked in 20% ACH for 2 hours, and rinsed in water for 3 hours. Peak frequencies are the same except where indicated. between ACH and forearm stratum corneum. The opposite was actually the case, as demonstrated by spectral subtraction. Fortunately, all six samples used in the forearm series of experiments produced spectra closely matched in overall absorbance. This showed good uniformity both in composition and in sample-to-sample pathlength, and produced conditions for reliable spectral subtractions (16, 17). Figure 7 shows the sub- tractions of an untreated control, which was prehydrated 68 hours, from three samples given the same ACH and rinse treatments but increasing prehydration times. Prehydra- tion time was varied since A1 sorption had previously been found to relate directly to stratum corneum prehydration (8). After using "appropriate" scaling factors, a number of new positive bands remain these indicate the formation of aluminum-protein bonding, while residual negative bands show protein reaction sites. While spectral subtraction can be a powerful technique, experience has taught us that certain criteria must be met before complete confidence is achieved (16). "Real" differ- ences are found when positive bands persist even after oversubtracting (using scaling factors obviously too large). Confidence is achieved when the frequencies of new bands

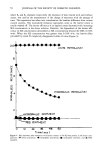
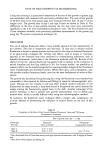
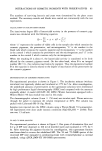
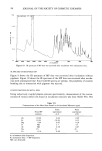
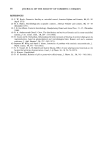
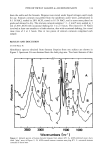
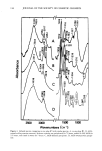
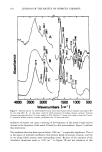
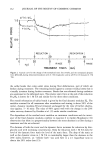
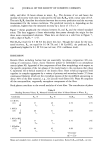
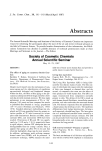
FTIR OF SWEAT GLANDS & ALUMINUM SALTS 121 i I I I I I 4000 3500 3000 2500 2000 1500 1000 500 Wavenumbers (CM '1 ) Figure 7. Subtractions of forearm stratum corneum spectra. ACH-treated minus control (68 hours prehy- drated). ACH treatments were all prehydrated, soaked in 20% ACH for 2 hours, and rinsed for 3 hours in water. Prehydration times for treated samples: A, 66 hours. B, 90 hours. C, 115 hours. that appear as a result of subtraction are different from those in either parent spectrum. Repeat subtractions with different samples must consistently produce similar results. Finally, control subtractions must be performed to determine if artifacts are produced (16). In our forearm stratum corneum subtractions, all four of the above criteria were met. A number of control subtractions, using untreated forearm stratum corneum, were performed, which produced virtually flat baselines at the same scale expansion as in Figure 7. This was due to the sample-to-sample uniformity and good pathlength match described above. Further, the bands which repeatedly appeared in Figure 7 (especially below 1800 cm-•) were at new frequencies not found in untreated stratum corneum. The band near 16 t0 cm-• seems to be due to a lowering of amide I peptide frequency due to coordination between aluminum and carbonyl groups. The literature is replete with examples of metal-amide or metal-amino acid complexation that result in the formation of new bands, mostly between 1600 and 1620 cm -• (l t-13, 18-24). With amino acid complexes, the band is attributed to a metal-carboxylate coordination (usually antisymmetric COO- stretch). The reappearance of the band near 772 cm- • in the subtractions in Figure 7 is particu-
Purchased for the exclusive use of nofirst nolast (unknown)
From: SCC Media Library & Resource Center (library.scconline.org)