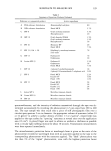
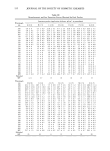
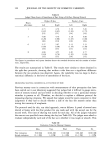
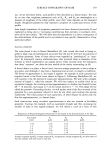
SHAVING CLOSENESS 143 cally significant. One could, therefore, expect that Product A would also produce a perception of increased shaving closeness. During the same shaving session, the pan- elists used Product A for preparing the beard of one-half of their face and Product B for preparing the second half. The protocol did not specify any set beard preparation times and the shavers were free to use their customary method of shaving. Half of the pan- elists used Product A on the right half of their face and Product B on the left half. The other half of the shaving panel used the opposite arrangement. During the second week, the sides were switched. The judges evaluated the level of smoothness of the face by tactile and visual examinations. The level of smoothness was then scored on a seven- point category scale. The evaluations were carried out at several times of the day, i.e., at different time intervals after the shaving took place. Each half-face was judged inde- pendently by each judge. Using parametric statistics, the mean scores and the standard deviations were calculated. The results are given in Table I. Naturally, the judges were unaware of the product used for a particular side. The results did not indicate the presence of any side bias, nor did they reveal any statistically significant differences between the two products or any changes with time (Table I). The variability of the data using the judges suggested that the errors due to day-to-day and person-to-person variations were too large to find differences in the level of smooth- ness of the face (coefficients of variations were of the order of 30-40%) (Table I). MEASURING SHAVING CLOSENESS ON A CATEGORY SCALE USING A FULL-FACE SHAVING PROTOCOL In this protocol, the panelists and the judges that were used in the second experiment were identical to those outlines in the previous section, except that full-face shaves were carried out with Product A and Product B on alternate days. The evaluation of shaving closeness was carried out in a manner identical to that outlined in the previous section. Table I Judges' Mean Scores of Smoothness of Face Using a Split-Face Protocol Product B face Product A face Hours after shave Left Right Left Right 1 4.88 4.85 5.15 5.25 (1.79) (1.63) (1.72) (1.72) [29] [33] [26] [22] 3 5.30 4.88 5.09 5.39 (1.64) (1.90) (1.61) (1.47) [26] [18] [27] [32] 6 5.95 5.99 5.11 4.96 (1.98) (1.66) (1.69) (1.67) [23] [24] [22] [20] 8 5.00 4.33 4.58 4.93 (1.74) (1.79) (2.01) (1.02) [24] [25] [26] [26] The figures in parentheses and square brackets denote the standard deviations and the number of evalua- tions, respectively.

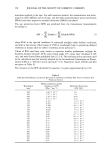
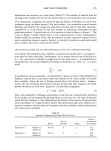
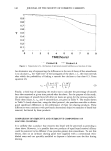
144 JOURNAL OF THE SOCIETY OF COSMETIC CHEMISTS Table II Judges' Mean Scores of Smoothness of Face Using a Full-Face Shaving Protocol Product B face Product A face Hours after shave Left Right Left Right 1 4.71 4.76 5.19 5.26 (1.67) (1.65) (1.92) (1.77) [21] [21] [14] [14] 3 4.08 4.76 5.18 4.98 (2.28) (1.88) (1.65) (1.68) [10t [10] [19] [19] 6 5.17 5.07 5.13 5.13 (1.85) (1.68) (1.54) (1.58) [15] [15] [13] [13] 8 4.86 4.55 4.81 4.77 (1.81) (1.78) (1.95) (1.85) [15] [15] [16] [15] The figures in parentheses and square brackets denote the standard deviations and the number of evalua- tions, respectively. The results are summarized in Table II. The results were similar to those obtained in the split-face protocols, showing that neither a side bias nor a significant difference between the two products was observed. Again, the variability was too large to find a statistical difference in the level of smoothness of the faces. MEASURING SHAVING CLOSENESS AS A FUNCTION OF TIME Previous sensory tests in connection with measurements of odor perception that have been carried out in our laboratory suggested that judges find it difficult to gauge inten- sities of sensory stimuli and are better in deciding whether or not a particular sensory stimulus is present at all. Therefore, we decided to explore a different protocol for measuring shaving closeness. We argued that judges would be more consistent in their judgments if they had to decide whether a side of the face felt smooth rather than noting the intensity of roughness. The protocol used for this, our third approach, was as follows: A panel of several men shaved at home with the first product for one week and with the second one for the second week. The time of shaving was noted for each day. All of the judges evaluated the men at two specified times during the day (see Table III). The judges were asked to evaluate independently each side of the face as to whether it was rough or smooth. This • Table III Evaluation Times for Shaving Closeness Mon. Tues. Wed. Thurs. Fri. First evaluation 9:00 AM 10:00 AM 11:00 AM 9:00 AM 10:00 AM Second evaluation 12-1 PM 1-2 PM 2-3 PM 12-1 PM 1-2 PM
Purchased for the exclusive use of nofirst nolast (unknown)
From: SCC Media Library & Resource Center (library.scconline.org)