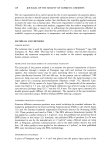
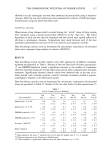
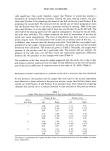
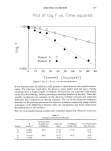
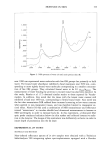
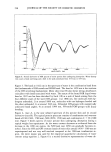
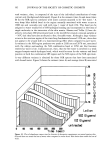
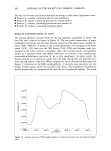
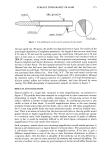
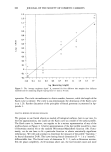
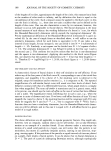
SURFACE TOPOGRAPHY OF HAIR 183 -0.5 0.5 1.5 2.5 3.5 log(spacing [•am]) -O.S O.S 1.S 2.5 3.5 log(spacing [•am]) Figure 7. Power spectra of intact (a) and bleached (b) hair surface profiles. One can distinguish two approximately linear segments of the spectra, corresponding to lower and higher spatial frequencies.

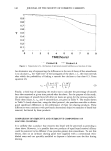
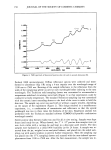
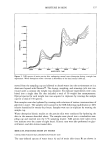
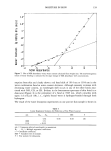
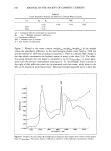
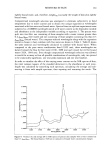
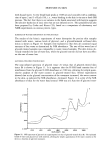
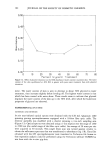
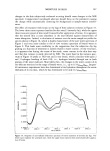
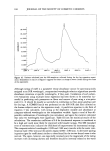
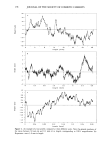
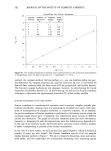
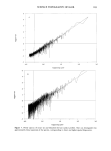
184 JOURNAL OF THE SOCIETY OF COSMETIC CHEMISTS frequency. Similar results have been obtained in studies of other surfaces, including scanning tunneling microscope observations of machined metal elements (14) and op- tical microscope observations of fused silica (15), as well as for mathematically con- structed random fractals (11). For the comparison of the amplitudes of particular features, one can select the part of the Fourier transform spectrum corresponding to a particular spatial frequency range. As an example, Figure 8 shows features having vertical sizes of 5 to 20 Ixm for untreated and bleached hair. This is a small section of a spectrum like that in Figure 7, presented in linear rather than logarithmic coordinates and corrected for the systematic effect of self similarity. One can easily see that the chemically treated hair surface has larger amplitude of surface features, which would correspond to a bigger value of the classical roughness parameter. The peaks in Figure 8 appear to be related to some specific elements repeating at certain spatial frequencies. However, attempts to ascribe the peaks in the power spectrum to actual periodic elements on the hair surfaces proved futile. The standard test used in such a case is to average a number of spectra in this way, random variations cancel out, while reproducible features become reinforced. Upon averaging, the individual peaks in the power spectra disappear or greatly diminish, pointing to an absence of preferred frequencies. This effect is even more visible in the whole spectrum (Figure 9), which is an average of 52 spectra like that in Figure 7, measured for hair from one source. The individual peaks decrease in amplitude and the overall feature, the linear dependence of log spectral power on log frequency, becomes more visible (16). The slope of this line is related to the fractal dimension of the surface. In the Fourier transform power spectrum of the form 1/f u the exponent B is a linear function of the fractal dimension (17), D s = 2.5 - B/2. In the power spectra of hair one can distinguish two segments of the line, separated by a saddle point at a period of ca. 10 Ixm. In the averaged spectrum of 52 scans of intact hair from the same source (Figure 9), the random noise diminishes considerably and the two segments are more clearly visible. The fractal dimensions of the two segments are Ds = 1.31 for the high frequency (small spatial dimension) end, and Ds = 1.63 for the low frequency (large spatial dimension) end. Bearing in mind that D may vary between 1 and 2, this differ- ence is quite significant. Translating these data into everyday terms, one could say that in the size range from 0.5 to 5 Ixm, the hair surface is "smoother" than in the range from 5 to 100 •m. CONCLUSIONS We have shown that measured profiles of hair have the properties of fractal objects and that therefore it is justified to use the tools of fractal geometry to characterize hair profiles. We have calculated the fractal dimensions of hair profiles using the spectral method. The measured values show a positive correlation with the visible roughness of the surfaces. More work is needed to refine fractal dimension measuring methods for better reproducibility and to correlate the fractal dimension with both the perceived and the physical properties of the surfaces. It has been shown that hair profiles are self-similar (self-affine) in a statistical sense that is, they are rough on all scale ranges. However, the fractal dimension and corresponding roughness can be different in dif-
Purchased for the exclusive use of nofirst nolast (unknown)
From: SCC Media Library & Resource Center (library.scconline.org)