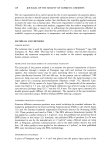
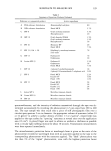
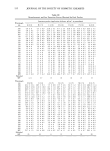
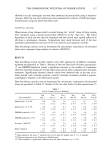
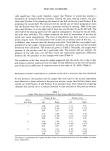
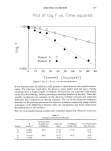
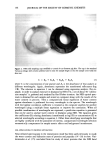
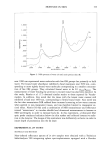
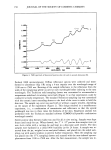
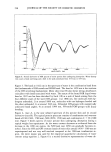
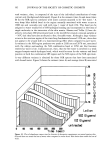
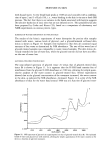
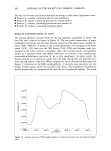
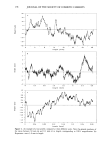
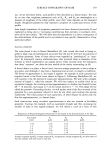
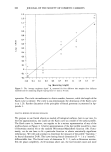
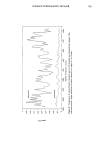
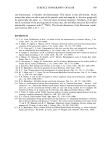
168 JOURNAL OF THE SOCIETY OF COSMETIC CHEMISTS •8.000' •6.000' •4.000' •2.000' •0.000' 8.000' , 6,000- 4.000- 2.000- 0.000' - •200.0 •.400 ß 0 :1600 ß 0 1800.0 2000 ß 0 2200.0 2400.0 HAVELENGTH Figure 16. Variance calculated over the 600-sample-set collected during the dry leg regression experi- ment. Resemblance to trace A of Figure 3 suggests that there is a change in water content during the course of the experiment. Although rating of itself is a parameter whose absorbance cannot be spectroscopically assigned to an NIR wavelength, computerized wavelength selection algorithms provide absorbance variations at specific wavelengths, if they exist. Correlation of such subjec- tive evaluations using multiple linear regression has been shown to be somewhat suc- cessful in predicting such parameters as flavor and texture of peas using a nine-point scale (11). It should be equally as successful in correlating our four-point grading scale for dry legs. A COMBO search was performed on the 600 NIR data files collected on the human subjects used in the regression study. A prediction equation in the form of equation 3 was calculated, with rating as the dependent variable and absorbance at computer-selected wavelengths as the independent variable. Again a total of four all- possible combinations of wavelengths was calculated, and again the statistics indicated that only two wavelengths were significant. Table III lists the statistical results of the calculations. The correlation coefficient of 0.8 for biochemical response is considered to be a high and could most likely be improved with broader ratings. The SEE (standard error of estimate) also indicates the likelihood of improvement by incremental ratings. The computer-selected wavelengths (1928 and 2100 nm) coincide with the water com- bination band (1922 nm) and the protein region (2050-2180 nm). A derivative pairing (opposite signs for coefficients) similar to those found for the in vitro bound water is also noticed. The signs, however, are expectedly reversed since the magnitude of the rating increases with increasing dryness and therefore should be inversely related to the water

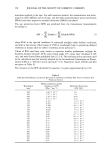
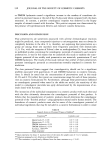
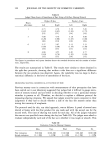
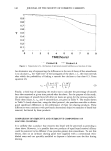
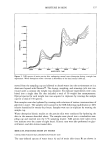
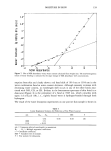
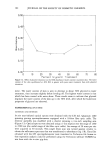
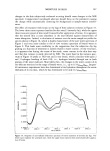
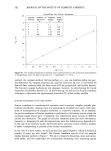
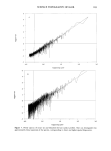
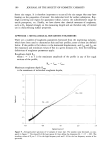
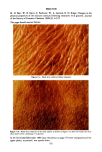
MOISTURE IN SKIN 169 Table III Linear Regression Statistics for Prediction of Dry Leg Rating nlTl K o . . . K. r SEE F 6.5 1928 - 25.5 2100 21.9 O.8O O.66 547 nm= Computer-selected wavelengths in nanometers. Ko . . . K. = Multiple regression coefficients. r = Correlation coefficient. SEE = Standard error of estimate. F = Test statistic for robustness. content of the in vitro experiment. Figure 17 shows the linearity achieved in predicting rating using NIR versus the actual rating of a trained evaluator. Ideally, the data scatter should be evenly distributed along the regression line but is not due to the restriction inherent in using a four-point scale with no half-way grades. The dry leg regression method (8) is designed to differentiate products' ability to main- tain skin in a smooth condition for some length of time. An analysis of variance (20) (ANOVA) with product as the between-subject factor is typically used to determine whether or not treatment means differ from each other. The TUKEY-A Significant Difference Test can then determine which specific treatment means differ from each -1 RCTUAL Figure 17. Plotof NIR predicted versussubjectiverating •rdryleg regression study.
Purchased for the exclusive use of nofirst nolast (unknown)
From: SCC Media Library & Resource Center (library.scconline.org)