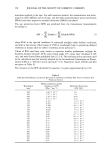
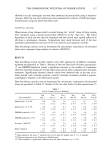
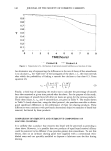
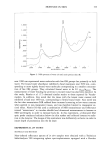
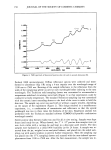
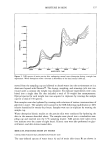
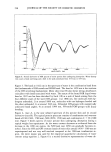
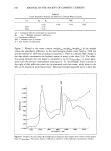
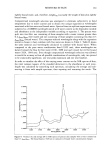
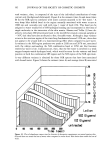
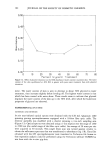
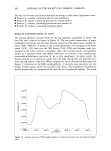
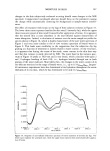
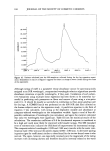
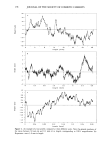
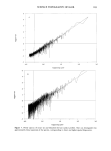
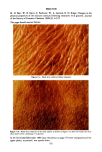
158 JOURNAL OF THE SOCIETY OF COSMETIC CHEMISTS .300' ß 200' ß ioo Z • o.ooo -. t00 -.200 -.300 ß . t900 2000 2t00 2200 2300 WAVELENGTH (nrn) Figure 6. Second derivative of NIR spectra of moist porcine skin undergoing desorption. Water desorp- tion causes a band narrowing and a shift in the peak minimum from 1914 nm to 1934 nm. Figure 3. The band at 1922 nm in the spectrum of water is the combination band from the fundamentals of OH stretch and HOH bend. The band at 1450 nm is the overtone of the OH stretching fundamental. Moist skin (trace B) also shows strong absorbances coincident with bands associated with water. The nature of the broad NIR liquid water band at 1922 nm has been described by Luck (18) as a sum of bands arising from the four different states of the water OH-groups: 1) at 1886 nm, free molecules with hy- drogens unbonded 2) at around 1899 nm, molecules with one hydrogen bonded and the other unbonded 3) at around 1936 nm, H-bonded OH-groups with energetically unfavored bond angles 4) at around 1984 nm, H-bonded OH-groups with linear bonding. Figure 4, trace A, is the near infrared spectrum of dry porcine skin and its second derivative (trace B). The typical protein spectrum consists of combination and overtone bands of CH (2300, 1700 nm), NH (2050, 1500 nm) and combination C = O (2180 nm). Figure 5 shows spectra of moist porcine skin undergoing desorption during a typical weight loss experiment. As the water content decreases as evidenced from the decrease in the 1900 nm region, the NH band near 2050 nm gradually becomes re- solved. Since the NH and OH overtone bands of moist skin around 1450-1500 nm are superimposed and not very well resolved compared to the 1900-nm combination re- gion, the latter region was used for the empirical quantitative calculations of water content using equation 2. Figure 6 is a second derivative representation of water de-

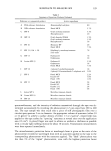
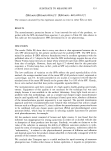
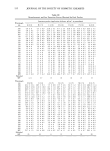
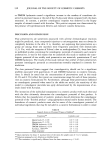
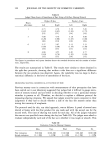
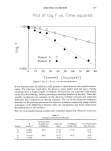
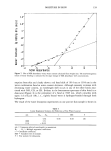
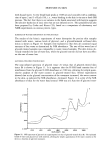
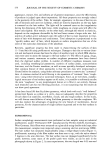
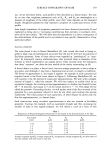
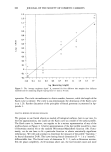
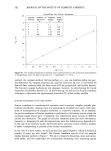
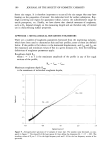
MOISTURE IN SKIN 159 .6- .4- .2- r Figure 7. Plot of NIR absorbance versus water content calculated from weight loss. The non-homogenous nature of water binding is indicated by the slope change of NIR absorbance with concentration. sorption from skin and clearly shows a red band shift of 1914 nm to 1934 nm in the water combination band as water content decreases. Although intensity increases with decreasing water content, no wavelength shift occurs in any of the other bands asso- ciated with NH, CO, or CH. Evident in the bottommost spectrum of skin dried in a desiccator (Figure 4) is the persistence of a band at 1945 nm, which coincides with types 3,4 of Luck (18), i.e., tightly bound water is hydrogen-bonded through both hydrogens. The result of the water desorption experiments on one porcine skin sample is shown in Table I Linear Regression Statistics for Prediction of Free Water Content nm Ko... K. r SEE F 4.44 1888 3.31 1116 - 16.91 0.96 0.08 281 nm = Computer-selected wavelengths in nanometers. Ko ß ß . Kn = Multiple regression coefficients. r = Correlation coefficient. SEE = Standard error of estimate. F = Test statistic for robustness.
Purchased for the exclusive use of nofirst nolast (unknown)
From: SCC Media Library & Resource Center (library.scconline.org)