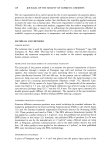
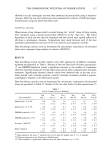
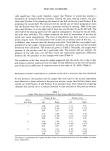
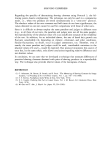
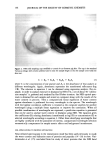
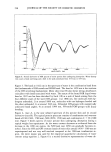
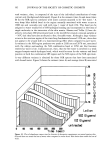
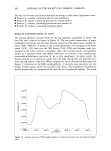
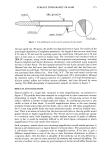
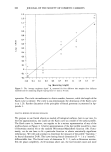
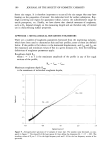
SURFACE TOPOGRAPHY OF HAIR 181 Figure 6a. Five consecutive approximations of the Koch curve (the first two lines are the initiator and the generator). The curve is self-similar: each of the upper patterns, when reduced in size, can be found repeated in the lower curve. convoluted, more and more "rough." Our working hypothesis is that D is a measure of the roughness of the real surface. There are a number of methods to measure the fractal dimension (9-12): the spectral

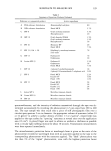
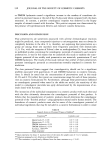
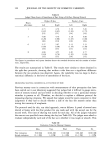
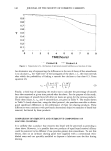
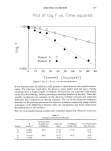
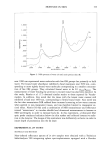
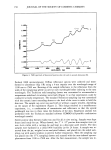
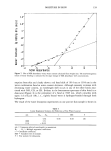
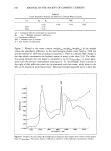
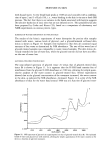
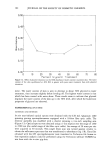
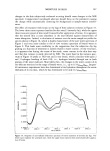
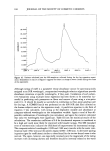
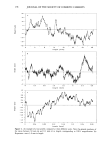
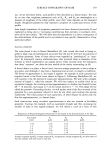
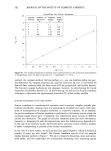
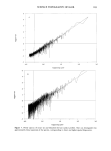
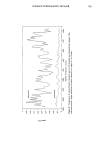
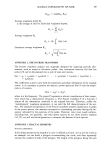
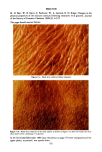
182 JOURNAL OF THE SOCIETY OF COSMETIC CHEMISTS 3.5 Calculating the fraetal dimension 2.5 - 1.5 1 0.5 0 [ 0 Approxi- Number of Segment Total marion: segments length length N: r: Nr: 1 1 1 1 2 4 1/3 1.33 3 16 1/9 1.78 0,2 0,4 0.6 0,8 1 1.2 1.4 1.6 1.8 log (l/r) Figure 6b. The number of segments in the Koch curve is plotted versus 1/r for consecutive approximations in bilogarithmic scale the slope of the line is D = 1og(4)/log(3) = 1.2618. method, the compass method, the box method, etc. one can therefore define the spec- tral dimension Ds, compass dimension D o and box dimension D b (13). It was shown (8) that all these methods yield the same value of D for geometrical, self-similar fractals. The box and compass methods are not adequate, however, for determining the fractal dimension of self-affine fractals (12). In the following, we will use the Fourier transform technique to determine the experimental dimension D s of hair surface profiles. FOURIER TRANSFORM OF THE HAIR PROFILE Fourier transform is a mathematical operation used to analyze complex periodic phe- nomena (waveforms), treating them as a superposition of simple sine waves. Such oper- ation of decomposition of complex waveforms is, relatively common. As an example, the process analogous to Fourier transform is performed in the hearing process where the incoming single sound wave is separated into information about sounds of different pitches and intensities. The graph of a Fourier transform gives just such information: intensity vs. frequency for each decomposed sine wave (for definitions see Appendix 2). In the case of an orchestra sound, the Fourier power spectrum would contain a number of peaks corresponding to pitches of the various instruments. In the case of a wavy surface, we will use the term spatial frequency, which is defined as number of crests per unit length. The Fourier transform spectra of all the samples display features typified in Figure 7. The plot is relatively featureless, lacks well-devel- oped peaks, and the amplitudes are continuously decreasing with increasing spatial
Purchased for the exclusive use of nofirst nolast (unknown)
From: SCC Media Library & Resource Center (library.scconline.org)