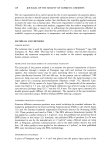
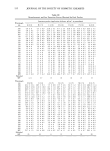
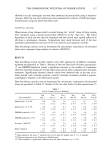
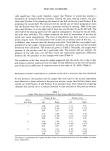
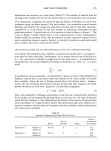
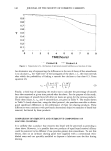
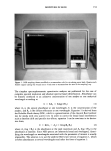
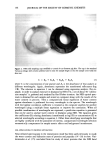
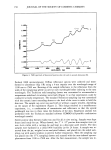
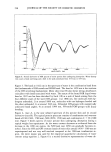
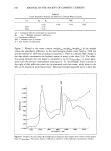
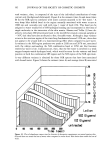
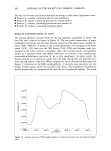
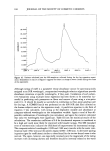
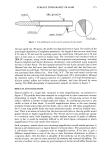
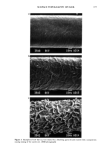
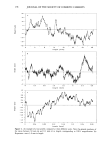
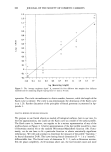
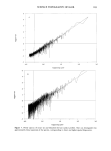
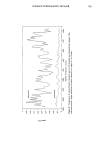
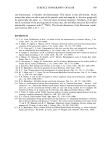
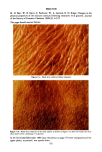
SURFACE TOPOGRAPHY OF HAIR 175 steel ABs plastic V/I//l////// I/I/ I/l/l/////// steel blade 0.25 Figure 1. The profilometric probe used for scanning the hair profile. the scan speed was 100 }xm/s the profile was digitized every 0.5 }xm. For studies of the scan-length dependence of roughness parameters, the length of the scan was varied from 0.56 mm to 56 mm and the scanning speed was varied from 100 }xm/s for 0.56 mm and 1.6 mm scans to 1 mm/s for longer scans. The instrument was interfaced with an IBM PC computer, using a serial interface. Data acquisition and processing, including Fourier transform and fractal dimension calculations, were performed using programs written in Turbo Pascal. The hair samples selected for this study included intact (new) Oriental hair that had never been bleached, dyed, or waved and that had been pur- chased from an individual. The hair that had undergone a commercial bleaching process was purchased from Alkinco Inc., New York, N.Y. The hair with raised cuticles was obtained by first reducing with ammonium thioglycolate (20:1 solution/hair), followed by treatment with a 15% aqueous solution of a copolymer of 4-vinyl-N-methyl-pyri- dinium methyl sulfate and sodium styrene sulfonate, and then followed by water rinsing. The SEM photographs of representative samples are shown in Figure 3. RESULTS AND DISCUSSION Typical profiles of a single hair, measured at three magnifications, are presented in Figure 4. The profiles have been measured on a single hair in three consecutive sections diminishing in length. The top profile, representing a 30-mm-long section of hair surface, exhibits a number of large peaks and valleys. An underlying structure is also visible in form of finer detail. A ten-fold magnification shown in the next drawing similarly reveals larger peaks and fine detail, and so does the 100 times magnification: the 0.3-mm long profile shows also some pronounced peaks, as well as detailed struc- ture. There is no reason to believe that the structure ends there or that the profile would appear smooth at higher magnifications. The 30-mm and 0.3-mm profiles are similar in a statistical sense, both displaying a rather random structure of peaks of different sizes in fact it would be extremely difficult to tell which figure corresponds to which magnification if the scale marks were removed. Such a property, namely where ever-increasing magnification reveals similar patterns, is known as self similarity and is a typical feature of a fractal object. The geometrical object is self-similar when it is congruent with its magnified version. If we have to give a different magnification in any of the two or more Euclidean dimensions to obtain a congruent object, then the object is self-affine. If the similarity can be only defined in a statistical sense, one uses the terms statistical self similarity and statistical self affinity. The sections of surfaces cut by a plane are good examples of statistical self-affine fractals (see

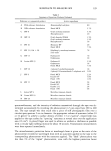
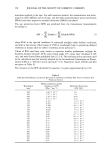
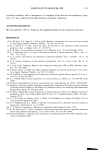
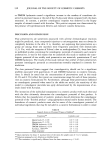
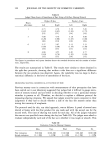
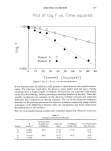
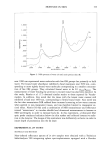
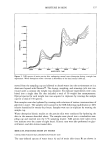
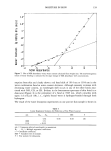
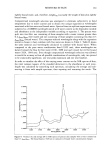
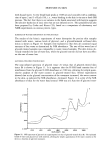
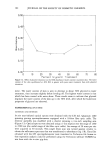
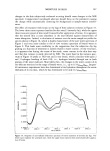
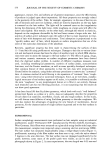
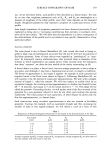
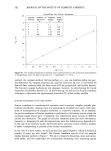
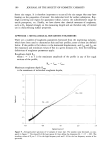
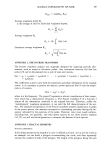
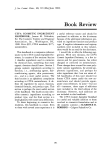
176 JOURNAL OF THE SOCIETY OF COSMETIC CHEMISTS 2750 5KJ X800 IO!4 Figure 2. An SEM photograph of the hair surface. Traces of the profilometric probe are visible in the center along the hair fiber axis. Appendix 3). In the following, we will discuss some implications of the self affinity of surface profiles. ROUGHNESS PARAMETERS Roughness parameters, taken mostly from metallurgy, are often used to characterize hair and skin surface profiles. Most popular parameters represent an average deflection of the profile from the mean line, calculated in one of several ways (for definitions see Appendix 1). They are generally thought to reflect some property of the surface, or, in our case, of its cross-section by a plane, the surface profile. We have calculated these parameters for the profiles obtained by measuring different lengths of the surface. Table I presents a summary of our measurements on four hair samples taken from the same source. Three parameters were selected: average roughness depth Rz, average roughness Ra, and geometric average roughness Rq. As one can see, the value of all three param- eters increases as the scan length increases. One could, in principle, obtain any required value of the roughness parameter by appropriate choice of the scan length. Figure 5 reveals that if Rz is plotted in bilogarithmic coordinates vs. the scan length, one obtains a reasonably linear dependence. The roughness parameter R• varies as a power of scan- ning length over two decades of length. This surprising observation is the first indication that the surface profile is not a usual, "well behaved" curve in the sense of Euclidean geometry. Any such Euclidean line, which one could, for example, imagine as a superposition of a finite number of simple sine waves, should have an "average deflection from the mean," while our profile does
Purchased for the exclusive use of nofirst nolast (unknown)
From: SCC Media Library & Resource Center (library.scconline.org)