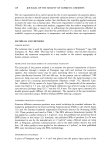
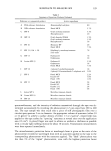
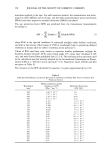
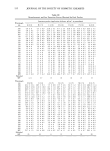
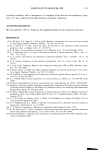
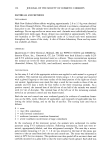
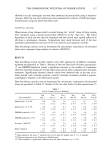
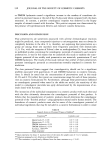
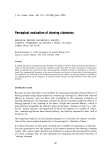
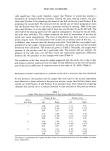
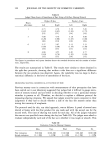
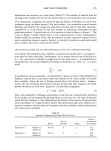
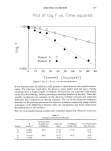
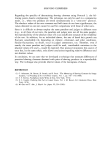
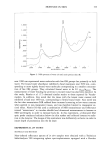
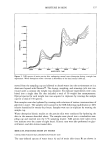
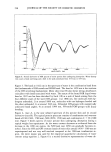
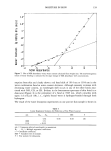
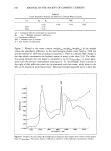
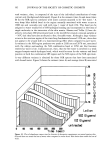
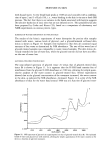
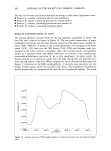
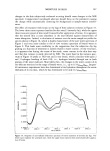
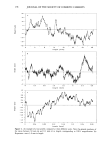
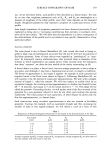
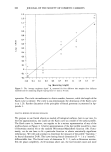
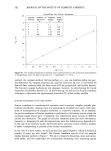
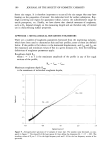
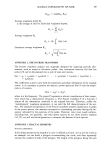
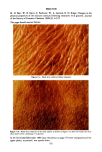
160 JOURNAL OF THE SOCIETY OF COSMETIC CHEMISTS Table II Linear Regression Statistics for Prediction of Bound Water Content nm K0... Kn r SEE F 0.09 1924 5.42 1964 - 5.26 0.98 0.02 1026 nm= Computer-selected wavelengths in nanometers. K 0 . . . Kn -- Multiple regression coefficients. r = Correlation coefficient. SEE = Standard error of estimate. F = Test statistic for robustness. Figure 7. Plotted is the water content (weightwet-weightd•/weight&y) of the sample versus the absorbance difference in the spectroscopist-chosen water band at 1930 nm and the baseline at 1850 nm according to equation 2. There is a definite slope change in the data which corroborates the biphasic nature of water in the skin (1,6). The inflec- tion point between the two slopes is calculated to be 0.34 gwater]gskin, in good agree- ment with the previous instrumental techniques (3-6). Accordingly, water contents to the right of this inflection point can be associated with free water, while those to the left can be associated with bound water. Desiccated samples appeared never to have lost :1.. B00' :1..600' :1..400' t. 200' 1. 000' .BOO' ß 600' .400' ß 200' 0.00C :1.200 :1.400 ' I • I • I • I • I i600 iBO0 2000 2200 2400 WAVELENSTH (rim) Figure 8. Variance (A) and average (B) in NIR spectra of porcine skin samples with a water content greater than 0.4 g .... r/gskiw The narrow band at 1888 nm is indicative of free hydroxyl concentration changes.

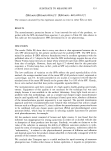
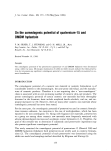
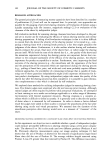
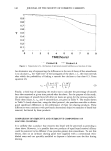
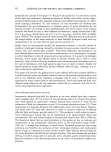
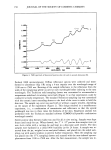
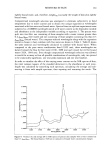
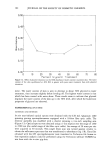
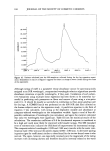
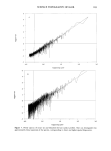
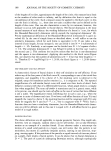
MOISTURE IN SKIN 161 tightly bound water, and, therefore, weightdry is actually the weight of skin plus tightly bound water. Computerized wavelength selection was attempted to eliminate subjectivity in band assignments due to water content and to obtain two unique equations at wavelengths associated with free water and bound water. Spectra from six replicate experiments were subjected to a COMBO wavelength search with water content as the dependent variable and absorbance as the independent variable according to equation 3. The spectra were split into two files: one consisting of those samples with a water content greater than 0.4 gwater/gskin (free water) and one consisting of those samples containing less than 0.3 gwater/gskin (bound water). The computer-selected wavelengths along with the regression statistics chosen to best correlate with free water are shown in Table I. Table II shows the same statistics and wavelengths calculated to correlate with bound water. When compared to the pure water combination band (1922 nm), these wavelengths are skewed toward the blue for free water (1180, 1888 nm) and toward the red for bound water (1924, 1964 nm). Even though computerized wavelength selection was allowed to search for as many as four all-possible combinations of wavelengths, only two proved to be statistically significant, one near peak maximum and one near baseline. In order to visualize the effect of the varying water content on the NIR spectra of skin, the total variance (square of the standard deviation) in the absorbance at each wave- length was calculated by smoothing each spectrum, calculating the average and sub- tracting it from each sample spectrum, then squaring and summing the result. The 3.500 3 ooo 2 500- • 2 000 • • •00 000- 500- 0 000 •, • I • I m I 1200 1400 1600 1800 B • I ' I I I 2000 2200 2400 HAVELENGTH (rim) Figure 9. Variance (A) and average (B) in NIR spectra of porcine skin samples with a water content less than 0.3 g .... r/gskin. The broad band at 1928 nm in indicative of bound water concentration changes.
Purchased for the exclusive use of nofirst nolast (unknown)
From: SCC Media Library & Resource Center (library.scconline.org)