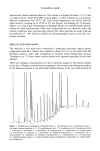
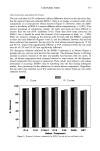
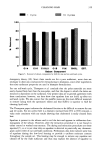
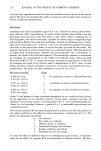
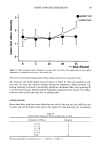
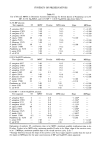
SYNERGY OF PRESERVATIVES 349 Table I Nonionic Lotion Formula Part Formula components Weight (%) A Mineral oil 7.50 Glyceryl stearate and PEG 100 stearate 3.50 B Water 30.00 Acrylic acid homopolymer/copolymer 0.20 TEA 99%* 0.30 C Methyl paraben 0.20 Water 58.30 100.00 * pH of lotion adjusted to pH 7.0 (+ 0.1) by addition of TEA. A batch of nonionic lotion was prepared and brought up to 99.9% of the final weight by the addition of water after cooling. Approximately 60 min before use in preservative efficacy testing, the lotion with 0.1% CaCI 2 was prepared by adding 0.5 g CaCI2 to 499.5 g of the lotion base, with several minutes of mixing. The control was prepared by adding 0.1% filter-sterilized deionized water to the remainder of the batch of lotion, with mixing. The pH of the lotion with 0.1% CaCI 2 was pH 5.7 and had a water-thin viscosity. The pH of the control lotion was pH 6.8, and the viscosity of this lotion was not changed noticeably by the addition of water. Aqueous samples of 0.2% MP, 0.01% Na2EDTA, 0.2% MP q- 0.01% Na2EDTA , and deionized water (control) were prepared for sterilization time (ST) determinations and were filter-sterilized by passing 5-ml aliquots of each solution through a 0.45-lxm filter in a Sweeny-type filter holder. Similarly, aliquots of stock solutions of phenoxy- ethanol (P) and Nipastat (N), which is a 50:15:10:20 mixture of methyl-, ethyl-, propyl-, and butyl-paraben, were added to sterile saline to give final concentrations of 0, 0.1, 0.5, and 1.0% P, and 0, 0.005, 0.01, 0.05, and 0.10% N. TEST PROCEDURES Preservative efficacy tests were performed using saline suspensions from surface growth of each test organism after incubation for 24 hr on TSALT, as described above. A 1oopful of growth was suspended in 5 ml of saline to give about 107 organisms/ml, and 0. ! ml of the saline suspension of each test organism was added to separate 50-ml portions of each test sample in a 100-ml screw-capped bottle. Samples were taken at designated times APCs were performed using Letheen Broth with 0.01% (v/v) Triton X-100 diluent and TSALT as the recovery system the Petri dishes were incubated at 37øC for all test organisms (except for both P. cepacia strains and P. fluorescens, which were incubated at 30øC) and D-values were determined by taking the negative recip- rocal of the slope of the survivor curve for each test organism in each test sample, as described in an earlier report (8). All tests were performed at least in duplicate, unless otherwise stated.

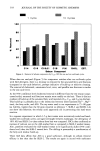
350 JOURNAL OF THE SOCIETY OF COSMETIC CHEMISTS STERILIZATION TIMES A modified preservative efficacy test was used to determine sterilization times (STs) for the test organisms in aqueous samples. The inocula were prepared as above and added to solutions of MP, Na2EDTA, MP + Na2EDTA, and deionized water (control). The contents of the tubes were mixed using a Vortex Genie Mixer, and samples were taken at 0, 2, 4, 24, and 48 hr by inserting a sterile swab into the liquid in each tube. A separate Petri dish containing TSALT was streaked with each swab. The Petri dishes were incubated for 48 hr at 30 ø or 37øC, depending on the test organism, as described above. The Petri dishes were examined for growth of the test organisms, and the ST was determined to be the first time at which test organisms were not recovered from the test solution. The ST and the concentration of organisms in the inoculum were used to calculate the slope of the survivor curve, correcting for the volume change that occurs when the inoculum is added to the test system. In these studies, the concentration of organisms in test tube samples was 1/100th the concentration in the inoculum because 0.1 ml was added to 10-ml solution in each test tube. D-values were determined by taking the negative reciprocal of the slope of each survivor curve (8). Where no endpoint was reached in the ST experiments, because the test organisms were still alive at 48 hr, the minimum possible ST (MPST) was used. The MPST was defined as a time longer than the last time at which test organisms were recovered (i.e., 48 hr). The MPST and the concentration of the organisms in the inoculum were used to construct a virtual survival curve. The maximum possible slope (MPSlope) of the virtual survivor curve and the corresponding minimum possible D-value (MPD-value) were calculated. DETERMINATION OF SYNERGY Synergism was observed when the slope of the survivor curve obtained with the com- bined components was a larger negative number than the sum of the slopes (or MPSlopes) for each of the components determined separately. WATER HARDNESS Duplicate samples of tap water tap water containing 0.01% Na2EDTA, adjusted to pH 7.0 by the addition of one drop of TEA and deionized water were tested for water hardness by the method of Betz Laboratories (9). A 0.1% 1342 dispersion was prepared by slowly adding 0.1 g 1342 to 99.9 g tap water with vigorous agitation. This dispersion was stirred for 2 hr at room temperature to allow hydration of the 1342. The beakers containing tap water and the 1342 dispersion were covered with aluminum foil and were allowed to stand, undisturbed, at room temperature for 3 days. The dispersion settled to about 1/3 of the liquid level in the beaker after this period. The water layer was decanted to give 1342-treated tap water. Duplicate samples of tap water, 1342-treated tap water, and freshly drawn deionized water were assayed for hardness (9). STATISTICS Mean D-values and standard deviation (s) were calculated. Statistically significant dif- ferences between mean D-values of duplicate experiments were determined by a two-
Purchased for the exclusive use of nofirst nolast (unknown)
From: SCC Media Library & Resource Center (library.scconline.org)