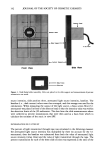
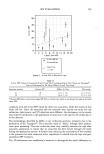
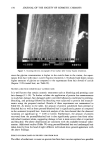
INHIBITION OF ODC INDUCTION 133 vidually exposed to a bank of four Westinghouse FS-40 sunlamps (primarily UVB radiation, peak of emission near 315 nm). The distance from the tubes to the dorsal surface of the mice was 45 cm. The UVB irradiance at this distance was 0.25 mW/cm 2. Mice were exposed three times weekly (Monday, Wednesday, and Friday) with 30 mJ/cm 2 UVB radiation per exposure (approximately ¾2 the mouse MED). Skin lesions were diagnosed grossly as tumors if they were circular, red, raised, and greater than 1 mm in diameter. Histopathological observation revealed these tumors to be neoplastic and non-neoplastic lesions. The neoplastic lesions were malignant squa- mous cell carcinomas and benign papillomas (squamous cell). These lesions were counted weekly as described previously (1). The tumor data were analyzed with respect to tumor yield (average number of tumors per mouse) and incidence (percent of mice with at least one tumor). The percent inhibition of tumor yield for a test material vs vehicle control was calculated from these tumor data at the end of the experiments (total treatment time 24-30 weeks) according to the following equation: [tumors per_mouse test material] 1 - [ tumors per mouse vehicle ] ) 100% The delay in onset (in weeks) until 50% incidence for a test material vs. vehicle control was calculated according to the following equation: t5o (test material) - t5o (vehicle) where t5o = time (in weeks) necessary to induce at least one tumor in 50% of the animals. UVR SOURCE OUTPUT Because these studies encompassed several years of work, the spectral output and irra- diance of both the solar simulator and the suniamps were monitored periodically. Spectral emission was measured with an International Light 791 radiometer equipped with an SIW170 probe. UVR irradiance was measured with an International Light 790 radiometer equipped with either an SED240 UVB probe, an SED015 UVA probe, or a WBS375 UVB + UVA probe. Both spectral emission and irradiance were noted to be relatively stable throughout the course of these experiments for both light sources. The spectral output was as that shown in reference 20. STATISTICAL ANALYSIS The data in Figures 1 and 2 were analyzed using the ranks of the data to determine the Spearman rank correlation coefficient. This is a non-parametric statistical technique whereby the observations are ranked from 1 through 25 for each variable separately and then the correlation is calculated from the resulting paired ranked data. The Spearman correlation coefficient does not depend on normality assumptions as the ordinary cor- relation coefficient does.

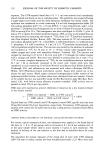
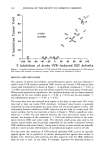
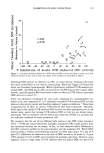
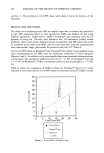
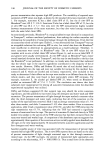
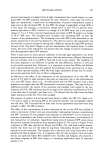
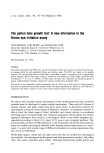
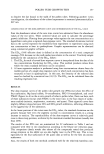
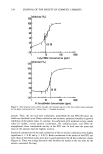
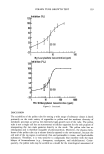
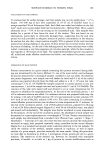
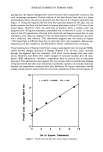
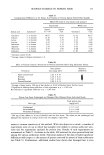
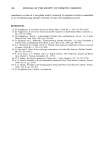
134 JOURNAL OF THE SOCIETY OF COSMETIC CHEMISTS lOO 60 60 40 •0 2O ol • o8 11 4 o o r=0.91 is o 120 l0 o p0.001 17 ø 16OO 14 0 9 15Oo13 19 o 26 25 24 21-23 20 0 O, , , CO , O0 , .... -100 -õ0 -60 -40 -20 0 20 40 60 õ0 100 % Inhibition of Acute UVR-Induced 0DC Activity Figure 1. Correlation between inhibition of UVR-induced ODC activity and prevention of UVR-induced skin tumor yield (number of tumors per mouse). Point numbers are identified in Table I. RESULTS AND DISCUSSION The capacity of several anti-oxidants, anti-inflammatory agents, and iron chelators to inhibit acute UVR-induced epidermal ODC activity and chronic UVR-induced skin tumor yield (multiplicity) is shown in Figure 1. A significant correlation (r = 0.91, p 0.001) exists between the acute and chronic assays for this mixed group of molecules. When tested separately for significance, the correlation between the two assays remained significant for the iron chelator group (r = 0.89, p 0.01) and the anti-oxidant + anti-inflammatory groups (r = 0.66, p 0.03). The tumor data were also analyzed with respect to the delay in onset until 50% of the mice had at least one tumor (50% incidence). Increased tumor latency is generally considered by many investigators as a more robust test of anticarcinogenic activity. The relationship between inhibition of ODC induction and the delay (in weeks) until 50% tumor incidence for the test materials is shown in Figure 2. While a significant corre- lation (p 0.001) was also observed between the acute and chronic assays in this analysis, the strength of the correlation (r = 0.86) was reduced relative to the corre- lation between ODC and tumor yield. The relatively small group sizes used in the chronic tumor studies may be partially responsible for the weaker correlation between ODC inhibition and tumor latency. Group sizes of twenty or more animals are generally used for a more accurate determination of anti-photocarcinogenic activity (25,26). The data show that inhibition of UVR-induced epidermal ODC activity by topically applied agents can be predictive of chronic photoprotection against skin tumors in hairless mice. However, false positives and false negatives with the ODC inhibition assay are sure to arise. In our study, for example, naproxen was relatively potent at
Purchased for the exclusive use of nofirst nolast (unknown)
From: SCC Media Library & Resource Center (library.scconline.org)