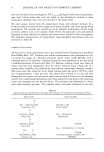
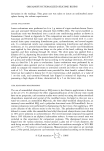
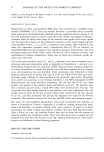
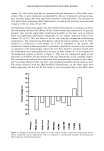
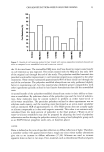
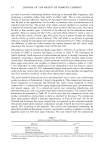
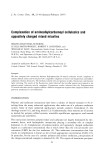
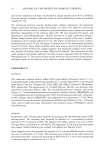
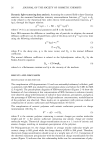
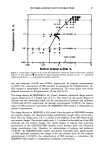
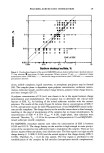
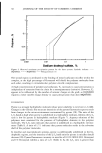
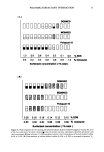
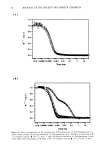
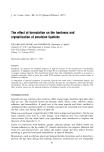
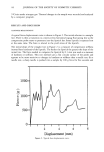
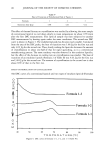
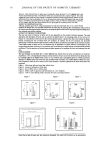
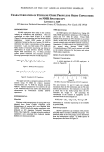
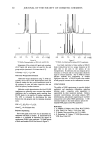
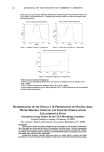
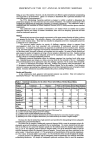
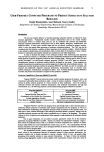
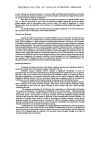
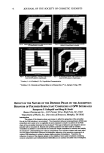
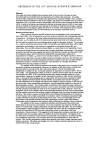
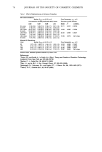
PREPRINTS OF THE 1997 ANNUAL SCIENTIFIC SEMINAR 59 CHARACTERIZATION OF ETHYLENE OXIDE PROPYLENE OXIDE COPOLYMERS BY NMR SPECTISCOPY Lawrence A. Goff ICI Americas Technical Innovation Center, ICI Surfactants, New Castle, DE 19720 I•TRODUCTION EO-PO copolymers have utility in the cosmetic industry as solubulizers and emulsifiers. They are synthesized as either block (Figure I) or random (Figure II) systems depending upon the desired end use application. Initial NMR studies of EO-PO copolymers focused on the use of proton (•H) NMR to determine the relative concentrations of the separate toohomers •. Later, low field carbon (•C) NMR (25 MYl. z) studies of monomer sequencing was limited to observations of dyads (EO-EO, EO-PO, PO-PO) 2. Higher field instruments (•3C, 75 M14_z) provided greater spatial resolution and increased sensitivity allowing spectroscopic analyses of triad sequences •. Figure I. Block EO-PO Copolymer Figure II. Random EO-PO Copolymer This paper provides a composite analysis of EO-PO systems using •H NMR for relative monomer concentrations and •C NMR for detailed structural analysis. Spectral assignments were aided by the use of the Attached Proton Test (APT) and distortionless enhancement by Polarization transfer (DEPT) experiment. EXPERIMENTAL Materials Ethylene oxide homopolymers of varying MW were obtained from Union Carbide. Propylene oxide homopolymers of varying MW were obtained from Aldrich. EO-PO block and random copolymers were produced at ICI Americas Technical Innovation Center, New Casfie DE. Average molecular weights of copolymers were calculated from hydroxyl number analysis (wet chemical method). NMR Spectroscopy All NMR spectra were obtained on a Varian 300 MYIz NMR spectrometer operating at 299.9 MYIz for proton and 75.4 MHz for carbon. Proton NMR samples were prepared as 30% solutions in d 6 acetone (Isotec, 99.9%) with 5% trifiuoroacetic acid added to remove residual water and labile hydroxyl resonances. Quantitative •H • analysis was performed using a ten second delay between NMR pulses. Tetramethylsilo.xane (TMS) and dcacetone were used as the internal references for the proton and carbon NMR studies respectively. RESULTS AND DISCUSSION Monomer Concentration A proton spectrum of a EO-PO copolymer is sho•'n in Figuxe III. 7 6 5 4 3 2 1 PP• Figure 1• 300 MI4.z lH proton NMR spectrum ofEO-PO copobzaer The area between 3.4 and 3.9 ppm (A) includes resonances from the EO methylenes and the PO ether methine and methylene. The resonance at 1.2 ppm (B) is solely due to the methyl group from the PO. Therefore the weight 5'o EO (assuming the contribution of the initiator is negligible) can be calculated from the area integrals (/). % EO (wt) = (111^ - 1 l/B) / (111^ - 8.33 I•) x 100 Information on toohomer sequencing is not available by proton NMR_ End Group Analysis EO-PO copolymers can terminate with primary (CI-I•OI-I) and/or secondary (CHOH) end groups. The chemical shifts of the end groups can be determined from the homopolymer spectra. nC NMR spectra of homopolymers are shown in Figure IV.

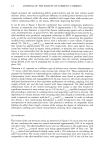
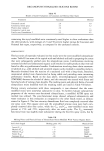
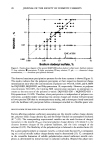
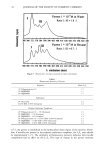
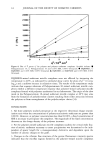
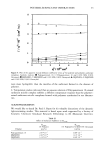
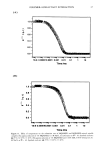
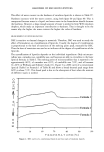
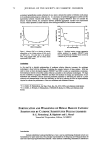
60 JOURNAL OF THE SOCIETY OF COSMETIC CHEMISTS 85 80 75 70 65 60 Fi•ttr½ •.V '•C NlvlR ofhomopol?m•s: a) PoeG-440 b) PPG-?2$ Integration of the primal, (62 ppm) and secondary (65-67 ppm) end group areas are used for the end group analysis (assumes # of initiator sites 2). %Primary=(I/Ip+l•) x 100 Molecular Weight Determination Molecular weight calculations using nC NMR are typically not as fast as MW determinations from the hydrox2,'l number but they avoid interferences such as the presence of water and other impurities that can effect the hydrox3'l number titrations. Molecular weight determinations for block EO-PO copolymers are generally more accurate than random copolymers due to overlapping peaks resulting from EO-PO dyacls in the spectra of random copolymers. The MW is calculated by determining the ratio between the end group(s) and the repeating monomer units. where F•, = # of initiator sites Polymer Sequencing One of the goals of this work was to determine if a copolymer was block or random. ff determined to be random it is desirable to determine the degree of randomness (DOR) in the copolymer. nC NMR spectra of block and random EO-PO are shown in Figure V. 85 80 75 70 65 60 PP.%5 Figure V '3C NMR of a) block and b) random EO-PO ½opobxners In a block copolymer a finite number of EO-PO dyads exists.gi•4ng rise to a unique resonance at 69 ppm that is not seen in the spectra of the homopolyrners. By definition, the area integrals of the resonance at 69 ppm and the end group(s) should be equal in a block copolymer. The nC NMR of a block polymer confirms this relationship. In random copolyrners the ratio of EO-PO dyads to the number of end group(s) increases as the randomness increases. CONCLUSION The ability of NMR spectroscopy to pro•"ide detailed qualitative and quantitative information regarding ethylene oxide - propylene oxide copolymers is unparalleled by other anal3•cal methods. Relative monomer concentrations, end group analysis, MW determinations, and polymer sequencing are available using proton and carbon NMR spectroscopy. I refer interested readers to the listed reference articles for detailed NMR papers on EO-PO copolymers. References 1. A. Mathais, N. Melior, Anal. Chem. 38, 472 (1966) 2. M.A. Carey, P.A. Turey, J. Cell. Plast. 1985 3. F. Heatley, Macromolecules. 21, 2713 (1988) 4. E. Breitmaier, W. Voelter, •SCNMR Spectroscopy, VCH, New York, 1987
Purchased for the exclusive use of nofirst nolast (unknown)
From: SCC Media Library & Resource Center (library.scconline.org)