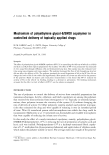
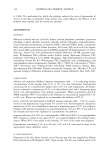
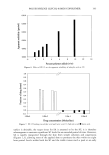
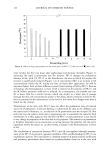
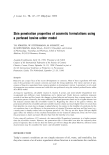
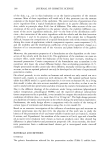
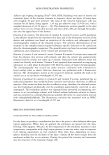
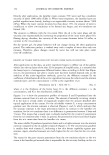
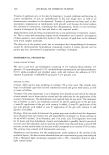
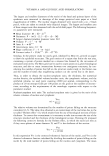
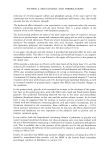
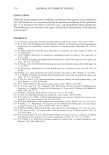
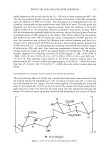
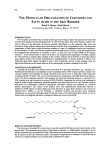
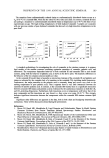
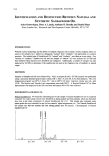
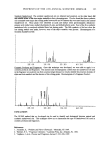
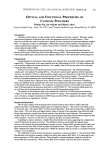
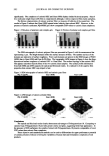
PREPRINTS OF THE 1999 ANNUAL SCIENTIFIC SEMINAR 195 Synthetic Sandalwood: The synthetic sandalwood oils we obtained and analyzed, on the other hand, did not exhibit either of the two major santalois in their chromatograms. We also found that these synthetic oils contained some major late eluting peaks between 40 and 45 minutes that were not found in the natural Sandalwood oil. These peaks were identified as acids and methyl esters (predominantly dihyctroiso- pirnaxic acid methyl ester, methyl-18-pimaren-18-oate, and dehyctroabiefic acid). Four of the five synthetic sandalwood oils we analyzed exhibited these late eluting peaks. The fifth synthetic oil did not show the late eluting methyl ester peaks, however, none of the major santalois were present. Chromatogram of a Synthetic Sandalwood Oil: 25 O0 30.00 35.00 40.00 Cosmetic Products and Fragrances: Once this technique was developed, we were able to apply it to cosmetic products and fragrances. The analysis and chromatograms confn-rn that the sandalwood oil used in the fragrance we analyzed was from a natural origin because we clearly identify the presence of peaks of alpha and beta santalois and the absence of late elutmg peaks. Chromatogram of a Fragrance Product: 25.00 30 O0 35.00 40.00 CONCLUSION: The GC/MS method that we developed can be used to identify and distinguish between natural and synthetic sandalwood oils. This technique allows us to characterize the type of Sandalwood Oil used in cosmetic products and fragrances. References: 1. Arctander, S., "Perfume and Flavor Chemicals, "Montclair, NJ. 1969. 2. Theimer, E.T., "Fragrance Chemistry, "Academic Press, Inc., Orlando, FL. 1982. 3. Verghese, J., et. al., Flavour and Fragrance Journal, 5: 223-226, 1990.

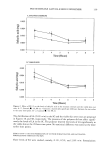
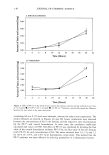
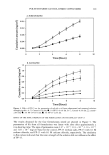
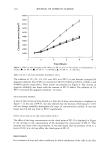
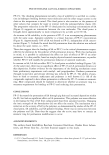
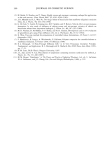
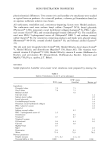
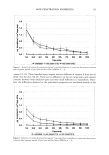
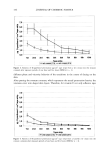
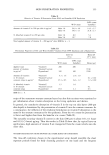
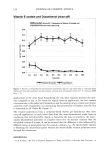
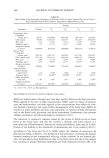
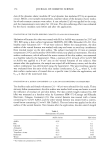
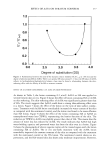
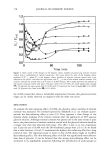
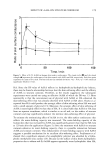
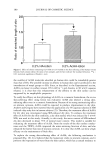
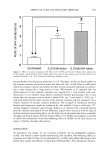
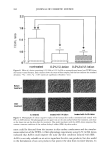
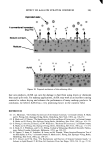
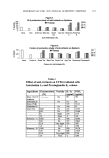
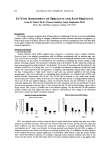
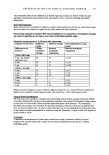
196 JOURNAL OF COSMETIC SCIENCE A CLINICAL MODEL FOR SURFACE SEBUM MEASUREMENT William D. Becker, Sharon Hillmer and Mark Presser Unilever Research, Edgewater, NJ 07020 INTRODUCTION Accurate and reproducible measurement of skin surface sebum levels is important to establish the efiScacy of compounds which could play a role in controlling oily skin. The objective of this study was to determine the variability of sebum accumulation for establishing panel size for subsequent trials using the Sebumeter SM810 Tm (Courage & Khazaka). MATERIALS & METHODS Nineteen subjects were assessed twice a week for six week. Subjects forehead were initially cleaned with Velin Tissue Paper for thirty minutes and sites were marked and located with a template. Sites were evaluated at either 1.5 or 3.0 hours post cleaning with a Sebumeter SM810. RESULTS & DISCUSSION CONCLUSIONS Skin surface sebum levels are highly variable. Some of the variables identified in this study which contribute to sebum levels fluctuations include subject-to-subject variation, visit to visit within subject, site-to-site within-subject and visit, and side-to-side within subject. A variance components analysis (SAS Proc VARCOMP REML) was conducted to estimate the relevant variance componenls for 1.5 and 3.0 hours, respectively. The magnitude of these sources of variability have direct implications in study design and panel size estimations vanante coml•onem esumates ana •,,,are •toots T=l.5 hours T=3.0 hours Variance component 1055.6 4491.3 Subject-to-subject 32.5 67.0 711.6 1047.7 Visit nested within subject 26.7 32.4 113.1 225.6 Side nested within subject 10.6 15.0 1321.8 1263.7 Site nested within subject x visit x side 36.4 35.5 (for half face design) 1389.6 1398.7 Site nested within subject x visit 37.3 37.4 (for full face desil•n) Subject Side Bias in Sebum Production It was found that most of the subjects (14 out of 19) on the test had a statistically significant and sizable side bias in mean sebum production across the study. For split face design studies, it is therefore essential to establish sebum baseline levels for proper balancing of the cells prior to any product application phase. Time & Site Dependent Forehead Differences The relative levels of sebum accumulation in the one and a half hour time point was significantly less than the three hour time interval (p=.0004). The sebum increase from 1.5 to 3.0 hrs followed different kinetic patterns on the upper vs. the lower forehead. In 1.5 hrs., the lower forehead accumulated 70% of the 3 hr. measurement, while the upper sites accumulated only 50% of the three hour total, regardless of proximity to the midline. Significant differences between the upper & lower forehead sites were observed, at the 1.5 hr. measurement at the sites closest to the midline, but at 3.0 hrs. these differences were not observed. Sites closest to the midline had significantly higher sebum levels a the 1.5 hr & 3.0 hr measurement
Purchased for the exclusive use of nofirst nolast (unknown)
From: SCC Media Library & Resource Center (library.scconline.org)