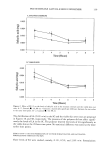
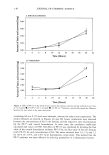
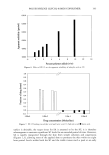
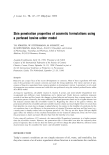
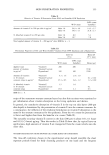
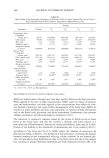
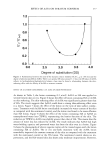
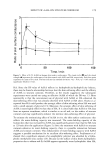
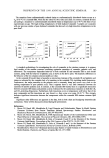
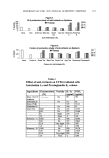
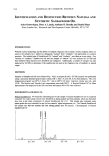
PREPRINTS OF THE 1999 ANNUAL SCIENTIFIC SEMINAR 197 This information indicates that differences in sebum regreasing kinetics are evident within the same individual, and therefore measurement at the same specific site is crucial for obtaining meaningful information. Panel Size Estimation Based on the levels of variability for subject-to-subject sebum production over this six week clinical study, the below tables for estimation of panel size for future studies has been calculated Panel sizes required to achieve 90% test sensitivity for a comparison of treatment change by a test of significance at Type I error level --0.05 (false positive rate). Sebumeter measurements at T=3.0 hours after degreasing Sebumeter Panel Sizes Half-Face Half-F•ce design Two Independent Groups design design Difference to be Within Between Between treatments detected treatment treatments comparison changes comparison (-10%)=20.5 units 3 sites per product 40 45 2 x 301 application area 2 sites 45 51 2 x 313 1 site 61 67 2 x 348 (-20%) = 41 units 3 sites 12 13 2 x 77 2 sites 13 15 2 x 79 1 site 17 19 2 x 88 (-30%) = 61.5 units 3 sites 7 7 2 x 35 2 sites 7 8 2 x 36 1 site 9 10 2 x 40 Studies should be designed to achieve relatively high test sensitivity, (i.e. at least 90% test sensitivity) to minimize the occurrence of false negative results. [test sensitivity = 100 (1-false negative rate)] Clinical Model Establishment The following issues should be considered when performing clinical studies using the Sebumeter SM810. A baseline sebum profile will need to be established (optimally, there should be Sebumeter readings taken at four visits over four weeks), before a product application phase can be initiat•xl. The information obtained in the baseline visits will allow for the proper balancing of the test cells based on right/left side bias, and relative sebum levels. In order to reduce the panel size it is recommended that at least three sites on the forehead (template determined) be monitored using the Sebumeter. Length of study will depend on product mode of action. Conclusion A method for the measurement of skin surface sebum levels using a Sebumeter SM810, has been proposed. The method will provide a means for the clinical measurement of the efficacy of sebum modulating agents.

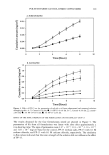
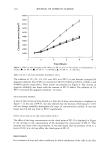
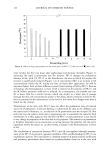
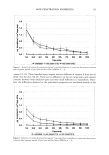
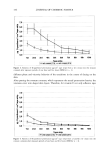
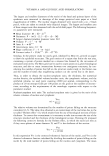
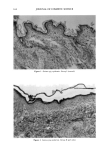
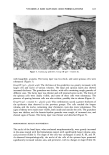
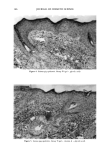
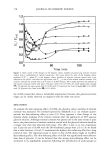
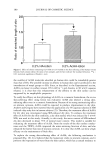
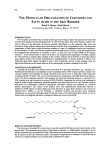
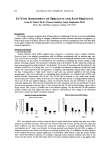
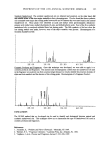
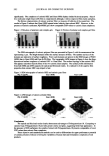
198 JOURNAL OF COSMETIC SCIENCE FATIGUE ANALYSIS OF HAIR Y.K. Kamath, S.B. Hornby, H.D. Weigmann and S.Ruetsch TRI/Princeton, Princeton, NJ 08542 INTRODUCTION: All materials suffer fatigue failure when subjected to low levels of strain repeatedly over long periods of time. This is especially true of fibers, which are materials of high aspect ratio. Human hair being a fiber of biological origin is no exception. Heterogeneity of its stoicrare makes it more prone to fatigue failure than its synthetic analogs. Stress concenlrafions at weak points can generate cracks which propagate to critical size on repeated strain cycling, leading to catastrophic failure. Human hair is subjected to low levels of tensile strain during various grooming processes. This can be considered as subjecting the fiber to tensile fatigue in the Hookian region. Since stress concenlrations develop preferentially in the regions of flaws, the method can be used as a diagnostic method to evaluate hair damage. In the same way, if there are trealments which reinforce the fiber stmcau•, their efficacy can also be evaluated. In this work we have presented evidence which indicates that both fiber damage and the amelioration of its effect on fiber failure by certain treatments can be achieved by tensile fatigue measurements. Effects of various parameters on failure probabilities and the fundamental processes which lead to fiber failure have been worked out extensively by Prevorsek and Lyons EXPERIMENTAL: Hair samples used in this study was obtained from DeMeo Bros. of New York. Chemicals used in this work were obtained from Aldrich or from the suppliers to the haircare imluslxy, meeting L-'I•A requirements, and were used as received. Reductive treatments were carried out with thiogiycolic acid (TGA, 10%, pH 9.8), glycerol monothioglycolate (GMTG, 10ø/0, pH 7.8) and Cysteamine (Cys, 10ø/0, pH 7.8). Treatment sequence was 20 min reduction followed by 10 min neutralization with 4.6% H202 at pH 2.6. Bleaching was done with 6% H20• at pH 7 for lh. A 4 hour bleach treatment consisted of 4 one hour treatments. Conditioner treatments involved dip coating in a solution of 0.5% for 10 min followed by 5 one minute rinses to remove the excess conditioner. Ten treaanents involved 10 of the above treatments in sequence with blow drying at low temperature in between each of the treatments. Fatigue life measurements were made on 3 cm long fibers. Cross sectional area of the fibers were determined by the laser micrometer and fibers from the middle of the distribution were selected. The apparatus used for this measurement, shown schematically in Fig. 1, was built at TRI, and was designed for constant load fatiguing. It consisted of two platens. Fibers were mounted on the upper platen and were loaded with a sufiable weight. The lower platen was moved up and down with a motor at a suitable f•equency, ranging from 0.7 -2.3 Hz. Each fiber was connected to an electrical circuit through a micro- switch to count the number of cycles survived by the fiber. The apparatus could accommodate 40 fibers per rim. RESULTS AND DISCUSSION: Characteristic Life: The fatigue life dam were treated by Weibull statistics [2]. Assuming that the lower bound of lifetime is 0, i.e., that the weakest fiber breaks when it is loaded for the first time, the cumulative probability of failure F(x) is given by • F(x) = 1- e o) Equation (1) can be linearized by taking 1ogaritluns of both sides to give, 1- F(x) (2)
Purchased for the exclusive use of nofirst nolast (unknown)
From: SCC Media Library & Resource Center (library.scconline.org)