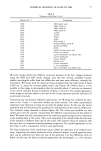
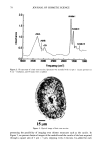
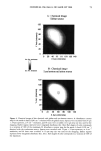
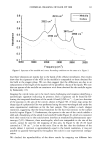
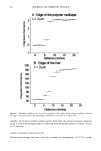
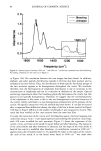
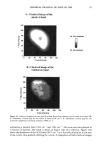
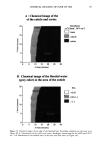
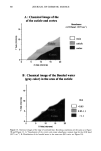
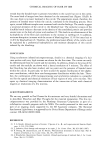
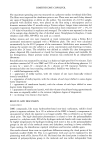
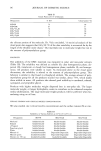
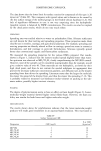
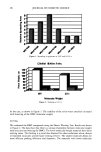
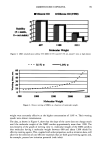
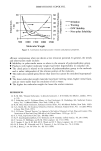
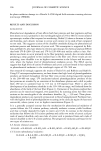
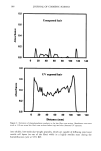
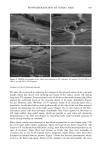
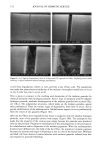
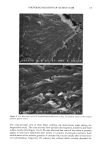
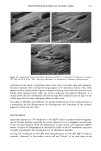
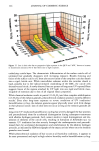
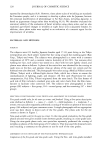
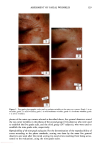
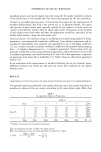
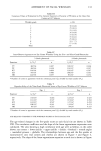
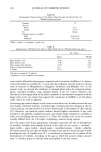
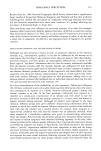
76 JOURNAL OF COSMETIC SCIENCE imaging was achieved by raster scanning the sample across the microfocused IR beam, taking a complete spectrum at each point. A two-dimension motorized sample stage was used for this raster scanning. The spatial resolution was controlled by the aperture size, except for very small apertures, when the resolution is limited by diffraction to a value comparable to the wavelength. For the synchrotron source measurements, the total area that can be rastered and mea- sured ("mapped") is somewhat controlled by the fact that an uninterrupted synchrotron beam is available for a period of about four hours. In principle, this could be extended by pausing the measurement for the five minutes needed to "re-fill" the synchrotron ring with electrons. Still, map sizes up to 20 x 20 (i.e., 400 spectra) can be collected in this way. Following conventional procedures, each spectrum was ratioed to a reference spec- trum to remove instrumental artifacts and yield the specimen's transmission. The data was then converted into absorbance units by taking the negative logarithm. We note that the synchrotron source intensity gradually decays during the time period for col- lecting the map spectra. This results in a gradually increasing baseline shift for the absorbance spectra, which is readily corrected by performing a linear baseline subtraction on each spectrum. Then, from these data, a map of the integrated absorbance of a specific frequency was built up. In comparison, experiments were also performed using the instrument's standard globar source. A total of 64 spectrometer "scans" (collection time of 30 seconds) were co-added at a given location to improve signal-to-noise ratio. The infrared flux reaching the detector, and therefore the signal-to-noise ratio, decreases with aperture size. The prac- tical lower limit for apertures was found to be 24 x 24 t•m, using the criteria that the noise not exceed =0.5% in absorbance for our experiments (18). In this case, since the apertures defined an area much larger than the studied wavelength (about 3 pm), the lateral resolution was determined by the size of the apertures and not by the diffraction. The specimen was sampled at 6-micron increments until the 120-1am x 140-1am square area encompassing the hair cross section was mapped. This process took approximately 3.6 hours, comparable to the measurement time using the synchrotron source. RESULTS AND DISCUSSION CHEMICAL IMAGING OF THE UNTREATED HAIR Chemically, hair mainly consists of keratin, a protein highly crosslinked by the amino acid cystine. The infrared frequencies characteristic of the intramolecular vibrations of this protein in the mid-IR (4000-900 cm -1) are given in Table I and are similar to those seen in our measured spectra (Figure 2). The amide I and amide II bands have intensities up to 2 absorbance units, which is well within the acceptable range for the instruments. Figure 3 shows an optical image of a hair sample. It clearly shows three distinct regions, namely the medulla in the center, the cuticle on the outside, and the cortex in-between. Infrared images were made on this sample using both globar and synchrotron sources. In each case spectra were taken as series of sample positions as the sample was scanned in two directions. The integrated absorbances of the different typical bands of the hair (Table I) were then extracted and contour maps showing the absorbances of the different bands as a function of position in the sample were obtained. Images obtained from all

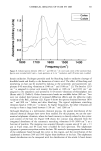
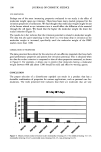
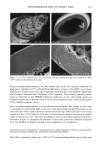
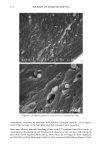
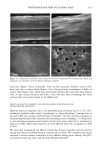
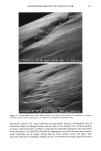
CHEMICAL IMAGING OF HAIR BY IMS 77 Table I. Vibration of the Hair (1-4,6) Region (cm -1) Assignment 3400 OH bonded water 3290 vNH, amide A 3200 vNH, amide B 3063 vNH, amide B 2962 1,'asCH 3 2918 VasCH 2 2875 VsCH 3 2850 l•sCH 2 1650 vCO, amide I 1540 vCH and 8NH, amide II 1450 8asCH 3 and 8CH 2 1390 85CH 3 1238 Amide III and nucleic acid 1219 Cisteic acid moiety 1196 va•S=O thiosulfate ions (Bunte salt) 1188 VasS=O sulphonate 1121 Cystine dioxide 1080 Nucleic acid 1071 Cystine monoxyde 1040 v•_S = O sulphonate 1022 v•S=O thiosulfate ions (Bunte salt) IR active modes exhibit the different structural domains of the hair. Images obtained using the vNH and vCH bands, though, gave the best contrast, probably because smaller wavelengths suffer from less diffraction and pass more efficiency through the instrument. We began with the chemical image obtained from the wide amide A band (3290 cm-•), using the internal globar source (see Figure 4A.) Notice that it is not possible in this image to distinguish either the medulla (about 12 microns in diameter) or the cuticle (annulus having a thickness of about 5 microns). The graded appearance of the image at the hair surface is also due to the 24-pm apertures and not indicative of a particular structure. Concerning the synchrotron radiation experiments, the IR beam was confined by aper- tures to an 11-pm x 11-pm area, within our noise criteria. The other experimental conditions were identical to those set up with the globar source. In this case the lateral resolution was still determined by geometrical considerations rather than by diffraction. The chemical image obtained is shown Figure 4B. The cortex and medulla are now clearly seen with the contrast coming from the different concentrations of the amide A band. We show that the concentrations of the stretching amide groups are less important in the medulla than in the cortex. This is not surprising if we consider that the structure of the medulla is different from that of the cortex (19), wherein there are airspaces (20) that give hair its important thermoregulatory properties. The graded appearance at the hair edge is still a consequence of the 11-pm aperturing. The high brightness of the synchrotron source allows the apertures to be reduced even more, improving the lateral resolution of the chemical images. A good signal-to-noise ratio can be achieved even when the size of the apertures is at the diffraction limit or below. In this case, the lateral resolution approaches the wavelength, i.e., a few microns
Purchased for the exclusive use of nofirst nolast (unknown)
From: SCC Media Library & Resource Center (library.scconline.org)