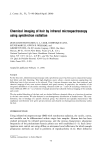
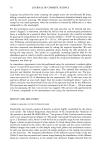
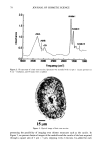
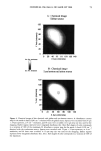
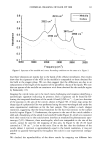
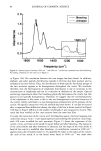
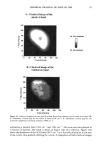
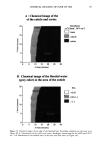
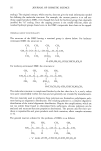
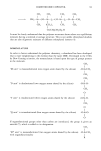
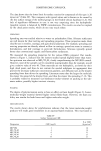
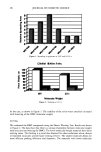
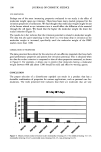
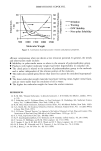
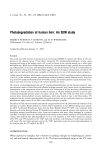
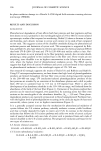
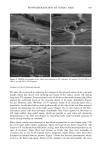
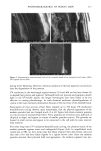
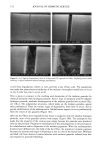
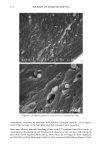
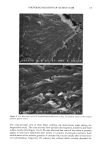
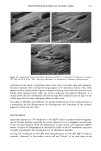
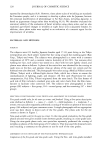
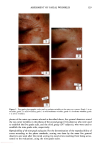
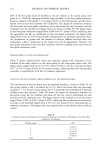
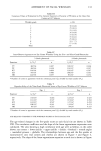
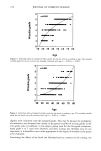
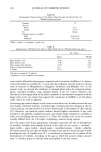
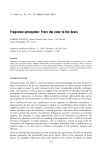
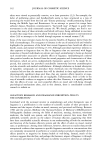
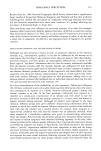
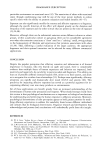
78 JOURNAL OF COSMETIC SCIENCE 2.0 - 1.5 0.5 Amide I , I • I , I • I 3500 3000 25(X) 2000 Amide III 0.0 I • I Frequency (off •) Figure 2. IR spectrum of a hair cross section. Spectrum was recorded with 12-1am x 12-1am apertures at 4 cm-• resolution, and 64 scans were co-added. 15 Hm Figure 3. Optical image of hair cross section. presenting the possibility of imaging even thinner structures such as the cuticle. In Figure 5, we present chemical images of the medulla and the cuticle of the hair acquired through a square area of 3 lam x 3 iam, stepping every 2 microns. Co-added for each

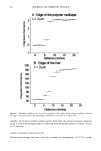
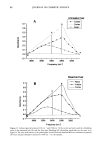
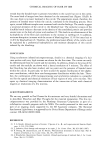
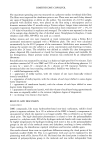
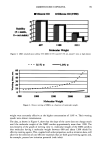
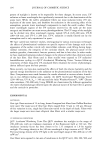
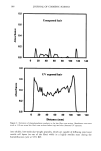
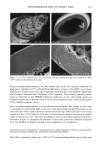
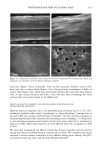
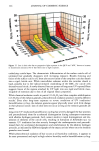
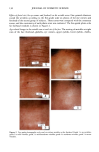
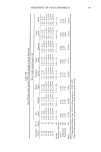
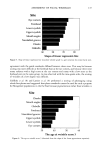
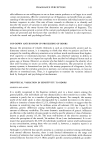
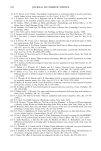
CHEMICAL IMAGING OF HAIR BY IMS 79 A ' Chemical Image Globar source 120 100 •: 8o P '• 6o •, 4o 20 Int. Abs. maximum . . Int. Abs. minimum I I 1 l 0 20 40 60 80 100 120 140 X Axis (microns) B ß Chemical image Synchrotron radiation source 120 lOO •' 80 '• 60 .• 40 20 0 0 20 4'0 6b 80 160 120 X Axis (microns) Figure 4. Chemical images of hair obtained with globar and synchrotron sources. A: Absorbance contour map for the amide A band (3290 cm -•) obtained with the globar source. Spectra were recorded with 24-Fro x 24-Fro apertures, at 4 cm-' resolution, and 64 scans were co-added. A 12-Frn step size was used for the mapping. Darker regions represent lower integrated absorbance (Int. Abs). Each degree of color corresponds to a variation of 10% of the maximum. B: Absorbance contour map for the amide A band (3290 cm-') obtained with the synchrotron source. Spectra were recorded with 12-Frn x 12-pm apertures, at 4 cm-' resolution, and 64 scans were co-added. A 12-Fro step size was used for the mapping. Darker regions represent lower integrated absorbance (Int. Abs.). Each degree of color corresponds to a variation of 10% of the maximum.
Purchased for the exclusive use of nofirst nolast (unknown)
From: SCC Media Library & Resource Center (library.scconline.org)