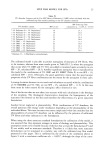
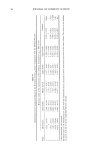
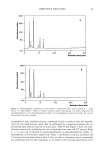
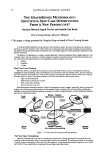
STEP FILM MODEL FOR SPFs 21 20 0.00 0.20 10 •__ 0.40 • : • • 0.60 0 -•- "--- -- "- 0.80 O• 1.00 f Figure 8. Section of the solution surface of the function A s f, the minimum of which occurs at the point g ß = 0.269, f = 0.935. the step film model, sunscreen formulations of different filter contents were manufac- tured and in vivo SPF values were determined according to the European protocol. From the concentrations of the UV absorbers used in these formulations, corresponding SPF values were calculated applying the calibrated step film model as described before. In addition, in vivo SPF values and UV filter contents of formulations published in refer- ences 13 and 14 were also used to test the model. In reference 13, formulations with a broad range of different filter combinations, including physical filters, had been manu- factured and assessed according to the COLIPA protocol. The assessment of formulations from reference 14 had been carried out according to the FDA method. Since both the COLIPA and the FDA protocols use 2 mg/cm 2 of sunscreen formulation, there should be no difference in the results. Tables II, III, and IV show the filter contents, the corresponding in vivo SPF values, and the SPF values calculated with the calibrated step film model of the formulations of this work, of references 13 and 14, respectively. In Figure 9 the correlation of in vivo and calculated values is shown. The slope of the correlation is 0.83 with an intercept on the abscissa at 0.55, and the correlation coef- ficient is r = 0.8957. DISCUSSION There have already been attempts to use a step film model in order to simulate invitro

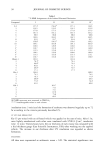
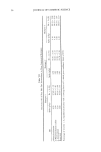
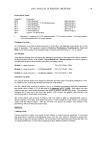
22 JOURNAL OF COSMETIC SCIENCE Table II UV Absorber Contents and In Vivo SPF Values of This Work (SPF values calculated with the calibrated step film model according to the UV absorber contents) UV absorber content SPF in vivo SPF from step film calculation (g = 0.269, f = 0.935) 5% OMC + 1% MBBT 12 ñ 4.9 t 10.8 5% OMC + 2% MBBT 12 ñ 4.5 • 12.7 5% OMC + 4% MBBT 19 ñ 2.82 16.9 5% OMC + 8% MBBT 30 ñ 7.1 • 29.3 2% MBBT 3 ñ 0.7 • 4.9 4% MBBT 5 ñ 2.2 t 6.5 8% MBBT 11 ñ 2.3 • 11.3 5% OMC + 2% MBBT + 2% BEMT 29 ñ 5.02 24.3 Formulation: see Appendix II. The error ranges are indicated for the in vivo results as confidence limits with 95% level of significance. • In vivo results with five volunteers. 2 In vivo results with --10 volunteers. Table III UV Absorber Contents and In Vivo SPF Values of Reference 13 (SPF values calculated with the calibrated step film model according to the UV absorber contents) SPF from step film calculation UV absorber content SPF in vivo (g = 0.269, f = 0.935) 5% TiO 2 7 5% OMC 9 7% Octocrylene 8 2% Octyl Triazone 8 3% Octyl Triazone 9 4% MBC 10 2% BMDBM 6 5% OMC + 5% TiO 2 20 4% MBC + 5% TiO 2 23 7% Octocrylene + 5% TiO2 24 2% BMDBM + 5% TiO 2 25 2% Octyl Triazone + 5% TiO2 21 5% OMC + 7% Octocrylene 10 3% Octyl Triazone + 4% MBC 11 3% Octyl Triazone + 5% OMC 12 5% OMC + 7% Octocrylene + 2% BMDBM 23 3% Octyl Triazone + 4% MBC + 2% BMDBM 26 3% Octyl Triazone + 5% OMC + 2% BMDBM 20 9.1 7.1 6.1 5.0 6.2 6.1 4.1 2O.5 18.1 15.9 11.5 16.4 12.6 10.1 11.7 20.7 23.7 26.6 SPF measurements (15). It is a new approach to calibrating the step film parameters with standard SPF formulations that was followed in the present work. The correlation depicted in Figure 9 shows that the calibrated step film model can be used to predict SPF values based on the concentrations and spectroscopic performance of the filters used. The accuracy of the estimation in terms of the correlation coefficient is obviously in the same range as the in vitro SPF measurements (16).
Purchased for the exclusive use of nofirst nolast (unknown)
From: SCC Media Library & Resource Center (library.scconline.org)