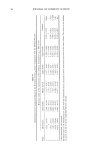
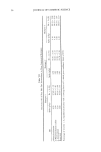
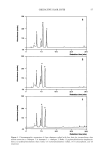
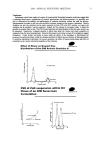
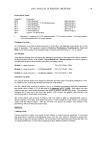
STEP FILM MODEL FOR SPFs 23 Table IV UV Absorber Contents and In Vivo SPF Values of Reference 14 (SPF values calculated with the calibrated step film model according to the UV absorber contents) SPF from step film UV absorber content SPF in vivo calculation (g = 0.269, f = 0.935) 7.5% Padimate O + 2% Oxybenzone j 18 14.1 7.5% Padimate O + 3% Oxybenzone 19 15.8 7.5% Padimate O + 4% Oxybenzone 23 17.5 7.5% Padimate O + 5% Oxybenzone 23 19.4 7.5% Padimate O + 6% Oxybenzone 28 20.8 7.5% OMC + 2% Oxybenzone 21 13.3 7.5% OMC + 3% Oxybenzone 20 14.8 7.5% OMC + 4% Oxybenzone 22 16.4 7.5% OMC + 5% Oxybenzone 19 17.9 7.5% OMC + 6% Oxybenzone 23 19.6 • Padimate O: 2-Ethylhexyl p-aminobenzoate. The calibrated model is also able to predict synergisms of mixtures of UV filters. This is, for instance, obvious from some results given in Table III (13), where the synergism that occurs when 5 % OMC and 5 % TiO 2 are added is simulated quite accurately (i, vivo SPF = 20, calculated SPF = 20.5). Another significant synergism that is reproduced by the model is the combination of 5% OMC and 8% MBBT (Table II, i, vivo SPF = 30, calculated SPF = 29.3). Obviously, the good agreement means that the spectroscopic properties of the UV filter combinations are the reason for the synergism in these cases. A strong deviation between i, vivo result and calculation occurred with the combination of 2% BMDBM and 5% TiO 2 (i, vivo SPF = 25, calculated SPF = 11.5). In this case there must be other reasons for the synergistic effect observed i, vivo. One of the factors that are not taken into account with such calculations is the theology of the emulsion. The rheological characteristics determine the homogeneity of the sunscreen film formed on the skin and therefore the effectiveness of a given sunscreen formulation. Another factor neglected is photostability. With combinations of UV absorbers, the overall spectrum will change under irradiation depending on the photostability of the individual filters. This issue becomes even more complicated when one considers that the photostability of certain UV absorbers can be influenced by the presence of additional UV filters and other substances in the formulation. When using the three sunscreen standard formulations for calibration of the model, it was assumed that they represent averages in terms of rheology and photostability. This assumption seems to be sensible because of the fact that at least the formulations P 1 and P3 are widely used as sunscreen standards. Therefore it is likely that most sunscreen formulations can be simulated in a realistic way with the calibrated step film model presented in this paper. This is confirmed by the results of the correlation shown in Figure 9 with a correlation coefficient of r = 0.8957, although the slope of the corre-

24 JOURNAL OF COSMETIC SCIENCE 40 ß Data of calibration points 0 Data ofthiswork ß Data of ref. 13 Data of ref. 14 Linear regression 0 0 10 20 30 40 in vivo SPF Figure 9. Correlation of SPF values obtained from step film calculations with parameters g = 0.269 and f = 0.935 and corresponding/, v/vo SPF data linear regression with intercept on abscissa = 0.55, slope = 0.83, and correlation coefficient r = 0.8957. lation of 0.83 indicates that the model tends to slightly underestimate the i. vivo SPF data. APPENDIX I Formulation of Standard P4 % w/w Trade name INCI name Supplier (as supplied) Part A Amphisol K Potassium cetyl phosphate Givaudan 2.00 Antaron WP 660 Tricontanyl PVP ISP 1.00 Myritol 318 Caprylic/capric triglyceride Henkel 5.00 Finsolv TN C•2 •5 alkyl benzoate Finetex 5.00 Cetiol SN Cetearyl isononanoate Henkel 5.00 Cutina GMS Glyceryl stearate Henkel 3.00 Lanette 16 Cetyl alcohol Henkel 1.00 DC 200 (350 mPas) Dimethicone Dow Corning 0.20 Tinosorb OMC Octyl methoxycinnamate Ciba Specialty Chemicals 5.00
Purchased for the exclusive use of nofirst nolast (unknown)
From: SCC Media Library & Resource Center (library.scconline.org)