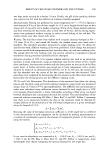
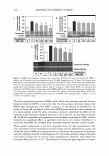
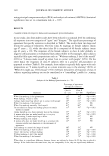
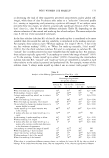
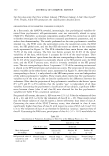
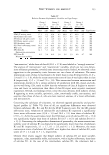
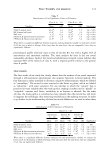
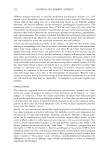
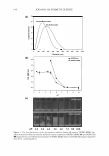
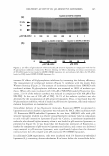
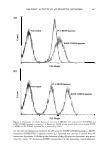
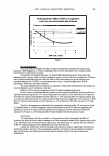
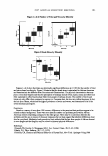
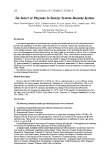
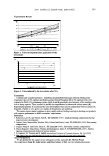
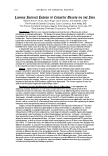
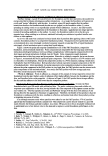
132 JOURNAL OF COSMETIC SCIENCE but they also enjoy their face without makeup ("Without makeup, I don't like myself" 17%). Finally, Table III summarizes the classifications detailed above. ORGANIZATION OF PSYCHOMETRIC VARIABLES IN SUBJECTS As a first result, the ANOV A revealed, interestingly, that psychological variables ob- tained from psychometric self-questionnaires were not statistically related to aging (Table IV). Thereafter, a principal components analysis (PCA) was carried out in order to further investigate the relations between measured psychometric parameters, and to reduce data dimensionality. The results performed on the nine psychometric variables retained (i.e., the STAI score, the extroversion score, the neuroticism score, the RAS score, the SEI global score, and the four SEI sub-scores) are shown in the correlation circle represented in Figure 1 a. The PCA identified three main factors that explain 71.8% of the total variance. The first two factors account for 62.6% of the initial variability of the data, while factor 3 accounts for 9.1 % of the total variance. Their projection in the factors' space shows that the axis corresponding to factor 1 (accounting for 51.6% of the total variance) is essentially related to the SEI general score, the RAS score, and the ST AI T-anxiety score, which is inverse! y correlated to the SEI general score. The axis corresponding to factor 2 represents 11.1 % of the remaining variance and is related to the EPI extroversion and neuroticism scores. The projection of the psycho- metric variables in the other factors' space, represented in Figure 1 b, shows that the axis corresponding to factor 3 is only related to the SEI home-parents score and independent of the others psychometric variables. These results show clearly that five psychometric variables out of the nine are able to describe satisfactorily the differences between the volunteers. Note that the projection of the psychometric variables in the factors' spaces (Fl vs F2 and Fl vs F3) confirms that the variable "age" is independent of all these variables. Concerning the psychometric classification of our subjects, significant differ- ences between classes (class A and class B) were observed for the five psychometric variables (see Table V for a statistical summary). For general self-esteem, the mean(± SD) score was 12.4 (±3.9) for the volunteers of class A (n = 21) and 20.6 (±2.4) for the volunteers of class B (n = 49). These results reveal that the female subjects of class B express a better self-esteem than those of class A. Concerning the mean of the STAI T-anxiety scores, data obtained in class A were significantly higher than those of class B, with respective scores of 46.6 (±8.1) and 35.6 (±5.5). The volunteers of class A can therefore be labeled as "anxious," opposite those of class B. Concerning the RAS score, participants of class A (-5.2 ± 16.2) were labeled as Table III Classification of Volunteers According to Their Use of the Makeup Process (n = 70) Main background for makeup Self-perceived value of natural face and make-up face Class A (n = 21) Camouflage Natural image made-up image Subclass Bl (n = 16) Natural image made-up image Class B (n = 49) Seduction Subclass B2 (n = 23) Natural image = made-up image Subclass B3 (n = 10) Natural image made-up image

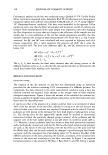
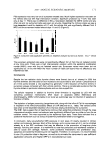
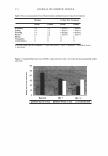
WHY WOMEN USE MAKEUP 133 Table IV Relation Between Psychometric Variables and Age Groups Group 1 Group 2 Group 3 Group 4 (n = 21) (n = 14) (n = 25) (n = 10) (30.2 yr ± 4) (40.2 yr ± 3) (50 yr ± 3) (59 yr ± 3) Variables Mean ±SD Mean ±SD Mean ±SD Mean ±SD Significance STAI (T-anxiety state) 37.3 6.2 36.8 8.5 40.8 8.7 40.0 9.5 NS SEI (General self score) 18.6 4.7 18.4 4.3 17.7 4.8 17.7 5.7 NS SEI (Social self-peers score) 6.6 1.6 6.9 0.8 6.2 1.7 5.8 1.6 NS SEI (Home-parents score) 6.7 1.5 6.5 1.5 5.9 1.8 5.3 1.9 NS SEI (Academic score) 6.4 1.2 6.1 1.4 6.3 1.7 5.5 1.9 NS SEI (Total self-esteem score) 40.3 7.4 40.9 6.3 39.3 9.4 38.2 11.4 NS RAS score 19.0 20.5 22.9 24.4 14.4 20.8 8.9 27.8 NS EPI (form B) 14.1 3.7 16.4 3.6 13.8 3.2 12.8 4.3 NS Extroversion-introversion EPI (form B) 8.9 5.4 10.6 3.8 9.6 3.9 8.0 4.7 NS N euroticism-stabili ty "non-assertive," while those of class B (26.1 ± 17 .8) were labeled as "strongly assertive." The analysis of "extroversion" and "neuroticism" variables, which are two core dimen- sions of human personality, revealed some interesting results. Indeed, we observed a clear opposition in the personality traits between our two classes of volunteers. The mean neurotic ism score of class A was found to be lower than in class B (respectively, 11.9 ± 2.8 and 15.3 ± 3.6), while the mean extraversion score of class A was higher than in class B (respectively, 13.5 ± 3.4 and 7 .6 ± 3.6). This interaction between extroversion and neuroticism, known to be a strong predictor of satisfaction with life, mood, and sub- jective well-being (20), tends to show that the volunteers of class A (higher in neuroti- cism and lower in extroversion than those of class B) report more negative emotional experiences. Overall, our findings reveal a clear two-class division, with subjects of class B appearing as more sociable, optimistic, calm, emotionally stable, non-anxious, and assertive than those of class A, who are more reserved, anxious, of a lower self-esteem, and non-assertive. Concerning the subclasses of volunteers, we observed opposed personality and psycho- logical profiles (cf. Table VI). First of all, no significant differences were observed between subclasses (Bl, B2, and B3) for the STAI T-anxiety scale. For the SEI general self-esteem score, volunteers of subclass B 1 and subclass B2 expressed a significantly lower mean self-esteem score (19.4 ± 1.9 and 20.0 ± 2.1) than those of subclass B3 (23.6 ± 1). As for the assertiveness level, the RAS mean score of subclass B3 (42 ± 15.4) was significantly higher than those of subclass B2 (26.7 ± 16.5) and subclass Bl (15.3 ± 13.3). Concerning the independent dimensions of personality, the mean neuroticism- stability score of subclass B3 was found to be significantly lower than that of subclasses B2 and Bl (respectively, 3.1 ± 1.7, 9.1 ± 2.9, and 8.1 ± 3.2). Moreover, the mean extroversion scores of subclasses B3 and B2 were higher that those of subclass Bl, with scores of 1 7 ± 2. 3 and 11. 7 ± 3, respective! y. Overall, these results suggest that female subjects of subclass B3 are more sociable, optimistic, calm, emotionally stable, and assertive, with a higher self-esteem, than those of subclass B 1. In the case of the intermediate subclass B2, the volunteers had a
Purchased for the exclusive use of nofirst nolast (unknown)
From: SCC Media Library & Resource Center (library.scconline.org)