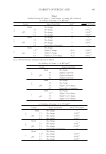
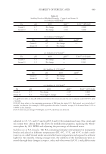
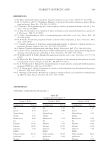
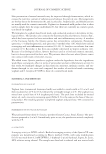
STABILITY OF FERULIC ACID 489 Table II Stability Result of Modifi ed Formula—Cream 9 and Serum 10 (a): Stability @ RT/dark[8] Fla pH ACO ⊿pH[1] F.A%[2] (RT/dark) Cream 9 4.7 No change -0.05 0.949 Serum 10 4.5 No change +0.04 0.969 (b): Stability @ RT/light[8] Fla pH ACO ⊿pH[1] Cream 9 4.7 No change — Serum 10 4.5 No change — (c): Stability @ 4°C/dark[8] Fla pH ACO ⊿pH[1] F.A%[2] (4°C/dark) Cream 9 4.7 No change — 1.000 Serum 10 4.5 No change — 0.990 (d): Stability @ 37°C/dark[8] Fla pH ACO ⊿pH[1] Cream 9 4.7 No change — Serum 10 4.5 No change — (e): Stability @ 45°C/dark[8] Fla pH ACO ⊿pH[1] F.A%[2] (45°C/dark) Cream 9 4.7 No change +0.07 0.806 Serum 10 4.5 Very slight C change +0.15 0.786 [1] ⊿pH here refers to the pH difference between the initial one and the one incubated under RT/45°C after 2 months. [2] F.A% here refers to the remaining percentage of FA from the initial 1%. Each result was tested after 2 months’ incubation. For example, 0.806 represents that after 2 months’ storage, F.A decreased from 1.0% to 0.806% in the formula. [3] F.A retention percentage @ RT/light and 37°C/dark was not detected. adjusted to 4.5, 5.5, and 6.5 and to pH 5.0 and 6.0 for serum-based ones. One cream and one serum were chosen from the above for modifi cation purposes, replacing the whole- water phase by 30% DPPG and adjusting the percentage of deionized water. Stability tests of F.A formulae. The F.A-containing formulae were prepared in transparent bottles and placed at different temperatures (RT, 4°C, 37°C, and 45°C in dark condi- tions) or on a shelf (stored under uncontrolled room temperature and exposed to ambient light) for two months. During storage time, the stability of the formulations were as- sessed through their changes in aspect, color, and odor status (A.C.O.), and pH/viscosity

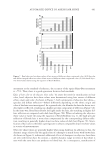
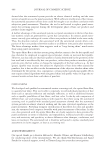
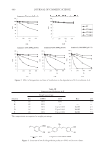
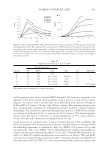
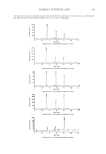
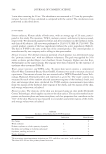
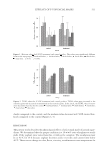
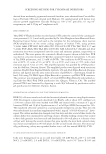
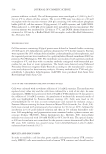
JOURNAL OF COSMETIC SCIENCE 490 Figure 2. Effect of temperature and time of incubation on the degradation of F.A in solutions A–E. Table III Composition of Solutions A–E Solution Weight percentage Base pH F.A DPPG H2O A 1% 30% 69% — 3.0 B 1% 99% — — — C 1% 30% Up to 100% NaOH 4.5 D 1% 30% Up to 100% NaOH 6.0 E 1% 30% Up to 100% NaOH 7.5 The compositions are expressed as weight percentage. Figure 3. Structure of two F.A degradation products—PVG and its trans-dimer.
Purchased for the exclusive use of nofirst nolast (unknown)
From: SCC Media Library & Resource Center (library.scconline.org)