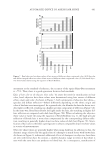
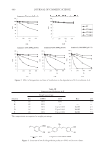
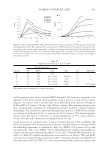
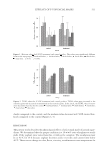
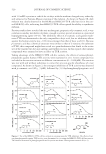
STABILITY OF FERULIC ACID 495 indicate that the stability of these F.A-based formulae clearly improved. Yellowing and odor issues were not observed, whereas the remaining fraction of F.A reached 81% in cream 9 and 79% in serum 10 after two months at 45°C. These results suggest that pH, temperature, and DPPG content appear to be possible factors affecting the stability of F.A in formulae. To further evaluate their infl uence in the degradation process of F.A, the stability testings of this compound were then performed in more simplifi ed systems, using water and/or DPPG as solvents. F.A’S STABILITY AND DEGRADATION PRODUCTS IN SIMPLIFIED SYSTEMS Effect of temperature, pH, and solvents on F.A degradation. The simplifi ed systems were com- prised of a series of aqueous dipropyleneglycol solutions (69/30, w/w) at pH 3.0 (F.A as free acid), 4.5, 6.0, and 7.5 (where F.A is completely in the form of sodium ferulate), and another in a 100% DPPG solution (F.A un-neutralized). These solutions were incubated at different temperatures, and their respective contents in F.A were further analyzed by HP.LC. Results, shown in Figure 2 and Table III, confi rm that the instability of F.A is pH, temperature, and solvent dependent. Degradation of F.A increases with increased tem- perature and pH. The degradation rates show strong differences between RT, 45°, 60°, and 75°. With the exception of solution B, the rates at 75°C appeared signifi cantly higher than those found at lower temperatures. The level of pH affects the degradation of F.A in a similar way, suggesting that F.A is more stable within a low-pH environment. The sol- vent DPPG showed a signifi cant effect in slowing down the process of F.A degradation. A comparison of the results in Figure 2A and 2B allows one to conclude that F.A degrades about fi ve times faster in an aqueous DPPG solution compared to 99% DPPG solution. Characterization of F.A degradation products. The HPLC chromatograms and mass spectra of dif- ferent F.A solutions, under various incubation conditions (different pH and/or temperatures for up to 60 days), showed that the F.A degradation products are similar (Appendix IV, Figure 11/Table XII). The peak retention time of F.A, in all cases, was 4.0 min. Figure 9. Effects of vitamin C and N2/air atmosphere on F.A degradation and PVG and its dimer’s formation in tested solutions. Solutions were incubated at 75° for fi ve days. The PVG and dimer accumulation% here were calculated in the same way as in Figure 4.

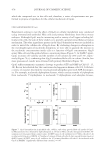
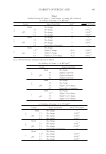
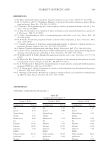
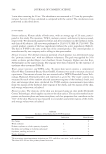
JOURNAL OF COSMETIC SCIENCE 496 Basically, two peaks represent two major F.A degradation products. Accordingly, we further processed the residue that was obtained from solution E, incubating at 75° for fi ve days and 12 days, then submitting to preparative HPLC according to the following procedure. The solutions were evaporated to oil-like residues and further column-chromatographed over silica gel (9). The eluates showed two major degradation products, 4-hydroxy- 3-methoxystyrene (also named as p-vinylguaiacol, PVG) and 1,3-bis (4-hyroxy- 3-methoxyphenyl)-l-butene (dimer of PVG) (refer to chemical structures in Figure 3). LCMS data exactly matched those of peaks at Rt = 7.3 and 10.0 min, respectively. Other trace components cannot be separated quantitatively. Further NMR and IR tests were carried out for confi rming the structure of these degrada- tion products. Detailed MS and NMR data are listed in Appendix V and are in agreement with the study of Fiddler and Parker (10). Kinetics of formation and behaviors of PVG and its dimer during F.A degradation. As F.A was the only “source” of a benzene ring in our experimental conditions, the isolation of these two products provided evidence that PVG and its dimer originate from F.A.Their respec- tive kinetics of formation under different test conditions were further analyzed, and re- sults are shown in Figure 4 and Table IV. With the exception of the un-neutralized solution A*, the kinetics of PVG formation showed similar shapes, perfectly fi tting with those of the intermediates. The contents of PVG peaked at approximately 80 hours of incubation, progressively decreasing thereafter. In contrast, the conversions of the dimer were all kept at low levels during the fi rst 80 hours. This fact suggests that the degrada- tion of F.A is a complex reaction, implying a decarboxylation process as a fi rst step, lead- ing to PVG (Figure 5) (11). In addition, almost no dimer was detected in the incubated solutions H–L, suggesting that PVG alone could not produce a dimer (Figure 6, Table V). As for the solutions containing additional PVG (solutions M and N), the induction time of dimer accumulation appeared shortened in solution N, mostly and to some extent in solution M (Figure 7, Table VI). From the results above we assume that the accumulation of the dimer refl ects the con- sumption of PVG, whereas F.A could be converted to dimer via an indirect route with Table VII Composition of Solutions P–S Solution Weight percentage Base pH Additional F.A DPPG H2O P 1% 30% Up to 100% TEA 7.5 Sweep with air + 0.2% Vit. C Q 1% 30% Up to 100% TEA 7.5 Sweep with N2 R 1% 30% Up to 100% TEA 7.5 Sweep with N2 + 0.2% Vit. C S 1% 30% Up to 100% TEA 7.5 Sweep with air The compositions are expressed as weight percentage. ∗In solution A, F.A was much more stable than in the others and took much longer time to degrade com- pletely and so through our study time, only a small amount of F.A was degraded in this system, and we were not able to get enough data to complete its accumulation curve.
Purchased for the exclusive use of nofirst nolast (unknown)
From: SCC Media Library & Resource Center (library.scconline.org)