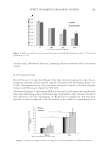
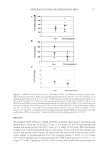
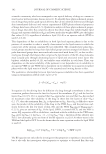
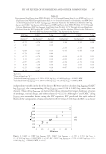
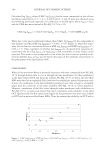
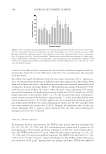
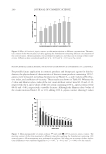
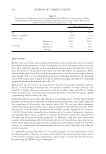
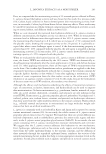
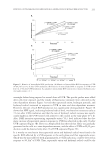
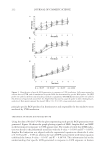
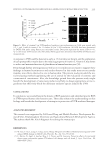
177 MENOPAUSE INCREASES FERRITIN IN SKIN RESULTS We analyzed levels of ferritin, VEGF, and TAC in human skin biopsies. Premenopausal women had a mean age of 41.6(±1.7 years, n = 6, range 40–44). For postmenopausal women, the mean age was 58.8 (±1.3 years, n = 6, range 55–60 years). Two skin biopsy samples were collected from both arms of each subject, and a total of 24 skin samples was used in the present study. Figure 1A shows that the mean level of ferritin was signifi - cantly higher in postmenopausal skin (542.4 ng/mg protein ± 194.3, n = 10, range 243.5–905.8 ng/mg) than in premenopausal skin (381.6 ng/mg protein ± 74.0, n = 12, range 277.4–481.5 ng/mg, p 0.05), a 42% increase. One outlier from postmenopausal Figure 1. Differences in levels of ferritin (A), VEGF (B), and TAC (C) between skin biopsy samples of pre- and postmenopausal women. Mean age of postmenopausal women was 58.8 ± 1.3 (n = 6), and mean age of premenopausal women was 41.6 ± 1.7 (n = 6). (A) The mean level of ferritin for premenopausal subjects was 381.6 ng (±74.0 SD, n = 12), whereas for the postmenopausal subjects it was 542.4 ng (± 194.3 SD, n = 10). (B) The mean VEGF level in the premenopausal subjects was 198.0 pg (±75.0 SD, n = 12), and for the post- menopausal subjects it was 109.1 pg (±60.2 SD, n = 10). (C) The mean TAC in the premenopausal subjects was 0.32 (±0.20 SD, n = 12), and for the postmenopausal subjects it was 0.21 O.D (±0.18 SD, n = 10). Results were expressed as nanogram ferritin per mg protein, picogram VEGF per mg protein, and TAC as absorbance (OD) per mg protein. *Signifi cant difference from premenopausal skin, p 0.05.

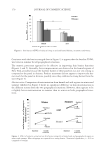
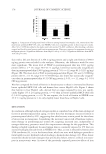
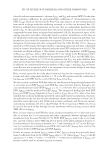
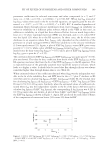
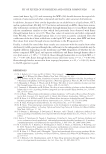
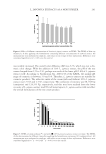
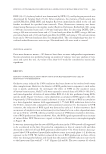
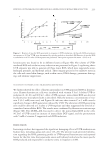
JOURNAL OF COSMETIC SCIENCE 178 skin with a left arm ferritin of 2,360.2 ng/mg protein and a right arm ferritin of 989.0 ng/mg protein was excluded in the analyses. Otherwise, the difference would be even more signifi cant. The mean level of VEGF in postmenopausal skin was 109.1 pg/mg protein (±60.2, n = 10, range 30.0–217.1 pg/mg), lower but statistically insignifi cant than in premenopausal skin (198.0 pg/mg protein ± 75.0, n = 12, range 84.1–322.5 pg/mg) (Figure 1B). The mean level of TAC in postmenopausal skin (Figure 1C) was 0.21 OD/mg protein (±0.11, n = 10, range 0.11–0.39 OD/mg), also lower but statistically insignifi - cant than in premenopausal skin (0.32 OD/mg protein ± 0.35, n = 12, range 0.2–0.94 OD/mg protein). We then compared the levels of ferritin in keratinocytes to those in immortalized human breast epithelial MCF-10A cells and human liver cancer HepG2 cells. Figure 2 shows that ferritin in liver HepG2 cells, derived from an organ targeted by iron, was signifi - cantly higher (33 ± 2.0 ng/mg protein, n = 6) than in breast epithelial MCF-10A cells (13 ± 0.6 ng/mg protein, n = 6). To our surprise, the levels of ferritin in NHEK were 23 ± 5.1 ng/mg protein (n = 4), only slightly lower than those in HepG2 cells. DISCUSSION In conclusion, although reduced estrogen in skin is considered one of the main etiological factors in postmenopausal skin aging, we show here that menopause increases ferritin in postmenopausal skin by 42%, suggesting that skin becomes a main portal for the release of excess iron in menopause. Considering the increased cancer risk of hormone replace- ment therapy in postmenopausal women (9), targeting increased iron, independent of estrogen defi ciency, presents a novel skin improvement therapy for this population. This fi nding is highly signifi cant because human skin is constantly exposed to UV that can increase hydrogen peroxide levels in NHEK (10). Thus, as iron is released by ferritin after UVA irradiation (6), it is in the ferrous form, which can react with hydrogen peroxide to form highly reactive hydroxyl radicals leading to biomolecular damage (11). Thus, future treatments should include strategies that specifi cally chelate, remove, or block iron trans- port in noncytotoxic ways. In view of the previously reported protective effects of iron Figure 2. Comparison of background levels of ferritin among human liver HepG2 cells, immortalized hu- man breast epithelial MCF-10A cells, and NHEK. Cells were originally grown in their respective media. After 24 h, 1% FBS was added to the media until cells reached 70–80% confl uency. After washing, cells were scraped and lysed for total protein and ferritin measurements. Data were expressed as nanogram ferritin per milligram protein. *Signifi cant difference from HepG2 cells (p 0.05) **Signifi cant difference from MCF- 10A cells (p 0.05).
Purchased for the exclusive use of nofirst nolast (unknown)
From: SCC Media Library & Resource Center (library.scconline.org)