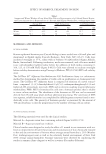
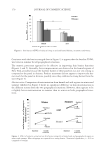
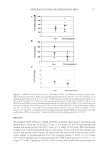
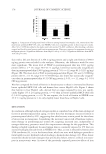
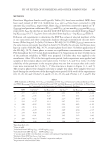
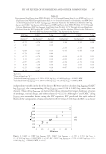
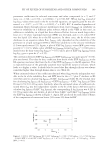
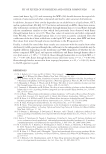
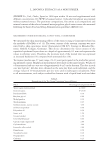
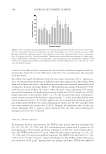
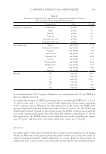
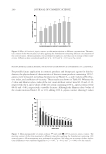
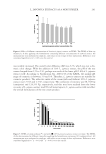
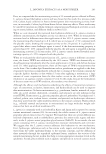
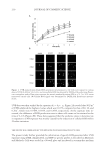
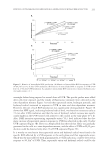
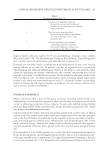
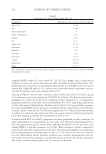
FIT OF FLUXES OF SUNSCREENS AND OTHER COMPOUNDS 187 independent variable in the fi t of the data to RS were used to calculate log JMHVEH (CALC2 log JMHVEH), the corresponding Δ log JMHVEH was 0.126 ± 0.065 log units (data not shown). These Δ log JMHVEH are better than those obtained for larger databases of series of prodrugs, various drugs, and other solutes (2–4,22,23). Although r2 and CALC2 Δ log JMHVEH are somewhat better using the RS2 equation, RS1 predicted the rank order of fl uxes of the components of sunscreens better (8/10 versus 5/10) than did RS2, so a choice Figure 2. CALC vs. EXP log JMHVEH: RS1, CALC1 log JMHVEH = –1.550 + 0.591 log SOCT + (1 – 0.591) log SVEH – 0.0065 MW, r2 = 0.92 RS2, CALC2 log JMHVEH = –2.159 + 0.481 log SOCT + (1 – 0.481) log SAQ – 0.000652 MW, r2 = 0.97. Table II Experimental Log Fluxes from VEH (PG:AQ, 30:70) Through Human Skin In vivo (EXP log JMHVEH), Log Fluxes from VEH Through Human Skin in vivo Calculated from Fit of Solubililty and MW Data to the RS Equation RS1 (CALC1 log JMHVEH), Absolute Values for the Differences Between EXP log JMHVEH and CALC1 log JMHVEH (Δ log JMHVEH), EXP log Fluxes from VEH (PG:AQ, 30:70) Through Silicone Membrane (EXP log JMPVEH), Log Fluxes from PG:AQ, 30:70 Through Silicone Membrane Calculated from the RS Equation RS1 (CALC1 log JMPVEH), and the Absolute Values for the Differences Between EXP log JMPVEH and CALC1 log JMPVEH (Δ log JMPVEH) EXP log CALC1 Δ log EXP CALC1 Δ log JMHVEHa,b log JMHVEHb,c JMHVEHb log JMPVEHb log JMPVEHb,d JMPVEHb 1 –2.72 –2.74 0.02 1.84 2.12 0.28 2 –2.50 –2.11 0.39 2′ –1.65 –1.65 0.00 3 –2.08 –2.23 0.15 –1.94 –1.66 0.28 4 –1.79 –1.83 0.04 5 –1.72 –1.76 0.04 –1.04 –1.35 0.31 6 2.44 –2.14 0.30 –2.08 –1.60 0.47 7 –1.87 –1.92 0.05 –1.64 –1.51 0.14 8 –0.78 –1.18 0.40 –0.29 –0.44 0.15 9 –1.25 –1.44 0.19 –0.87 –1.03 0.16 10 –0.13 +0.07 0.20 a Ref. (21). b Units of μmol cm–2 h–1. c Calculated from log JMHVEH = –1.550 + 0.591 log SOCT + 0.409 log SVEH – 0.00652 MW. d Calculated from log JMPVEH = –1.198 + 0.760 log SOCT + 0.240 log SVEH – 0.00842 MW.

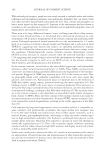
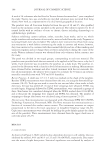
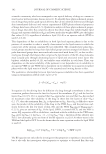
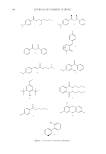
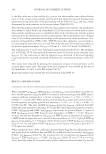
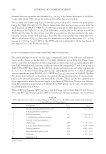
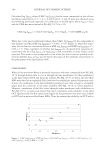
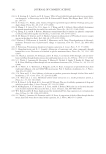
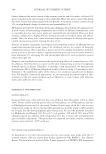
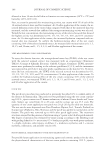
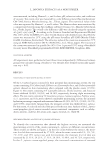
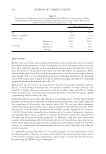
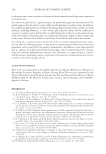
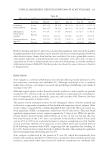
JOURNAL OF COSMETIC SCIENCE 188 between the two equations and whether SVEH or SAQ is the better descriptor of solubility in the polar phase of SC cannot be made until further data are available. The y coeffi cient (from y log SLIPID) from RS1 gives a value of 0.59 with the polar phase being the VEH, PG:AQ, 30:70. This is lower than what has been seen in vivo with the lipid mineral oil (MO) as VEH (0.72) (28) but is similar to what has been seen in vitro with water as the VEH (0.54) (4). This difference could be due to the interaction of the VEH with the skin. In the present case, PG may permeate the skin and alter the solu- bilizing capacity of the skin making it more PG-like (more polar) than lipid-like (17). Hence calculation of JMHVEH becomes less dependent on a polar descriptor: [(1 – y) log SPOLAR = 0.28 log SAQ] if MO is the VEH and more dependent, (0.41 log S VEH ) if PG:AQ (30:70) is the VEH (see above). FLUX OF SUNSCREENS AND OTHER COMPOUNDS THROUGH SILICONE The molar absorptivities (ε) for the eight compounds used in the diffusion cell experi- ments at their λMAX in the PG:AQ, 30:70, VEH (VEH) are given Table III. These ε were used to calculate the amount of each compound in their respective receptor phases. The new EXP solubility and partition coeffi cient values for compounds 2′ and 3 are given in Table I. The EXP fl ux values for the delivery of selected sunscreens and other compounds (1, 3, 5, 6, 7, 8, and 9) from Hagedorn-Lewke and Lippold (21) (n = 7) and 2′ through silicone membrane from PG:AQ, 30:70 (EXP log JMPVEH) are given in Table II. Neither PG, water, nor methanol are known to irreversibly change the properties of silicone mem- branes like ethanol, propanol, and butanol do (25,26). Those reports are supported in these experiments where the second application fl uxes of ThH from PG were not different from the reported control value of 0.00208 ± 0.00068 μmol cm-2·h-1 (23) obtained after an initial application of water. When EXP log JMPVEH, MW, log SOCT, and log SVEH values from Tables I and II were fi t to the RS equation using the SPSS 19 statistical software package, the estimated Table III Molar Absorptivities (εVEH) and λMAX Values in PG:AQ, 30:70, the VEH for the Compounds Evaluated in the Diffusion Cell Experiments Compound λMAX εVEHa 1 Octyl 4-dimethylaminobenzoic acid 314 1.23 ± 0.01 2 4-Isopropyldibenzoylmethane 2′ Dibenzoylmethane 347 1.95 ± 0.04 3 3-(4-Methylbenzylidene) camphor 307 2.22 ± 0.03 4 Isoamyl 4-methoxycinnamate 5 Oxybenzone 290 1.46 ± 0.07 6 3,5-di-t-butyl-4-hydroxyanisole 283 0.29 ± 0.006 7 Dibutyl phthalate 228 0.85 ± 0.03 8 Butyl 4-hydroxybenzoic acid 256 1.62 ± 0.03 9 Triclosane 280 0.45 ± 0.04 10 Biphenyl-2-ol a L mol-1 × 10⁴.
Purchased for the exclusive use of nofirst nolast (unknown)
From: SCC Media Library & Resource Center (library.scconline.org)