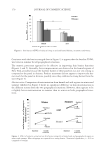
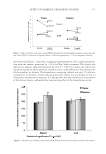
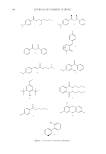
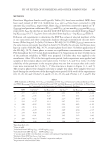
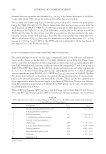
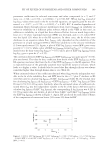
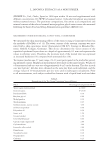
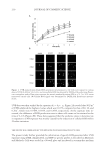
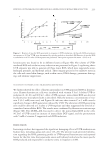
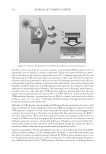
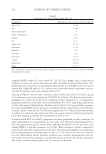
FIT OF FLUXES OF SUNSCREENS AND OTHER COMPOUNDS 185 METHODS Data from Hagedorn-Leweke and Lippold’s Tables (21) have been modifi ed. MWs have been used instead of MV (14). Solubilities (csOc and csV) have been converted to mM amounts (SOCT and SVEH, respectively), fl uxes (JMAX) have been converted to μmol cm-2·h-1 (JMHVEH) and partition coeffi cients (PCOCT:Vand PCOCT:W) are now KOCT:VEH and KOCT:AQ, respectively. SOCT for oils that are miscible with OCT have been calculated from log SVEH + log KOCT:VEH (16,17). SAQ have been calculated from log SOCT − log KOCT:AQ (Table I). Diffusion cell experiments to determine the EXP fl ux values of selected members of the in vivo sunscreens and other compounds database through nonreinforced silicone mem- branes (Pillar Surgical, La Jolla, CA) from a PG:AQ (30:70) VEH (JMPVEH) were run in the same way as previously described in detail (23). Briefl y, the silicone membranes were kept in contact with PG:AQ, 30:70, receptor phase for at least 3 h before application of the PG:AQ, 30:70, donor phase to ensure an equilibrium concentration of water (and PG) throughout the 0.254-mm thick membrane (24). Suspensions (at least 10-fold excess of the permeant solubility in VEH) were prepared 1 h before they were applied to the membranes. After 20 h of the fi rst application period, fresh suspensions were applied and samples of the receptor phases were taken every 3 h (for 5, 8, and 9) or every 1 h if the solubility of the permeant in the receptor phase was too low to ensure that sink condi- tions were maintained for 3 h [for 1, 2′ (the structure is shown in Figure 1), 3, and 7]. The receptor phases were changed each time a sample was taken. Five samples were ana- lyzed during the steady state of the fi rst application period (48 h total) of the experiments (20, 23, 26, 29, and 33 h for 5, 8, and 9 23, 24, 25, 26, and 27 h for 1, 2′, 3, and 7). For Table I MW, Solubility in PG:AQ, 30:70 (SVEH), Solubility in OCT (SOCT), Partitions Coeffi cient Between OCT and VEH (KOCT:VEH), Partition Coeffi cient Between OCT and AQ (KOCT:AQ), and Solubility in Water (SAQ) for Compounds in the Sunscreens and Other Compounds Database MW log SVEHa,b log KOCT:VEHa log SOCTb,c log KOCT:AQa log SAQb,d 1 277 –2.14 4.67 2.53 5.75 –3.22 2 266 –1.95 5.27 3.33 6.51 –3.18 2′e 224 –1.21e 3.48f 2.27e 4.43g –2.16 3 254 –1.47h 4.14 2.67 5.13 –2.46 4 248 –0.92 3.83 2.91 4.83 –1.92 5 228 –0.43 2.90 2.46 3.82 –1.36 6 236 –1.29 3.79 2.49 4.64 –2.15 7 278 –0.58 3.43 2.85 4.39 –1.54 8 193 –1.01 2.44 3.45 3.42 0.03 9 289 –0.14 3.61 3.47 4.53 –1.06 10 170 1.42 2.22 3.64 3.07 0.57 a Data from Ref. (21). b Units of mM. c Calculated from EXP log SVEH + EXP log KOCT:VEH. d Calculated from EXP log SOCT – EXP log KOCT:AQ. e 2′ was not part of Ref. (21) database, so values were measured experimentally. f Estimated from EXP log SOCT – log SVEH. g Calculated from log KOCT:VEH by Colander’s regression analysis. h Experimental value measured here.

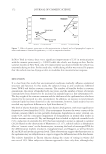
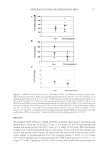
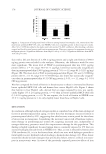
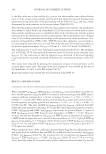
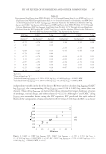
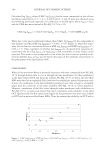
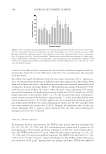
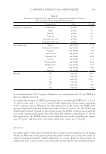
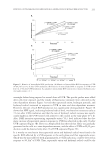
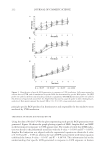
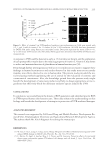
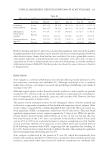
JOURNAL OF COSMETIC SCIENCE 186 6, the fl ux value was so low and the εVEH was so low that samples were collected about every 12 h for a total of four samples over the 48 h fi rst application period. Samples were quantitated using ultraviolet (UV) spectroscopy and the EXP UV λMAX and εVEH values determined for each permeant in the receptor phase (Table III) (23). After the fi rst application period of 48 h, the donor phases were removed, the membranes were washed 3 times with 5 ml of methanol (25,26) and contact between fresh receptor phase and the membranes were re-established. After 24 h of leaching the initially applied permeant from the membranes into the receptor phases, the receptor phases were changed every 2–8 h to allow more effi cient leaching of the permeant out of the membranes. Sus- pensions of theophylline (ThH) in PG (ThH/PG) were then applied as a second applica- tion and samples were taken at 6, 24, and 49 h using the same UV analysis procedures as for the fi rst application where UVMAX = 270 nm, ε = 1.02 × 10⁴ L mol-1 for ThH (27). The solubilities for 2´ and 3 were determined as previously described (23). The solubility of 3 in PG:AQ, 30:70, was repeated because we noticed a decrease in the intensity of its λMAX at 307 nm with time so that the apparent εVEH decreased. A decreased apparent εVEH would lead to increased calculated solubilities for a measured absorbance in the UV of 3. Flux values were obtained by plotting the cumulative amount of each permeant in the receptor phase versus time. The slope of the plot in μmol h-1 was divided by the area of the membrane (4.9 cm2) to give fl ux in μmol cm-2·h-1. Regression analyses and correlations were performed using SPSS 19. RESULTS AND DISCUSSION SUNSCREENS AND OTHER COMPOUNDS DATABASE FIT TO THE RS EQUATION When the EXP log JMHVEH, MW, log SOCT, and log SVEH values from Tables I and II were fi t to the RS equation using the SPSS 19 statistical software package from IBM, the pa- rameter coeffi cient estimates for n = 10 (not including 2′) were x = −1.550, y = 0.591, z = 0.00652, r2 = 0.92 for RS1. When log SAQ instead of log SVEH values were used in the fi t to the RS equation, an equally good fi t was observed: r2 = 0.97, x = −2.159, y = 0.481, z = 0.00065 for RS2. The plots of EXP log JMHVEH versus log JMHVEH calculated from RS1 (where the polar parameter is PG:AQ, 30:70) and RS2 (where the polar parameter is water), CALC1 log JMHVEH and CALC2 log JMHVEH, respectively, are given in Figure 2. A plot of EXP log JMHVEH versus MW showed a poor dependence on MW (r2 = 0.49). However, we have retained the dependence of JMHVEH on MW because of the physical signifi cance of MW found for larger data sets (3,4) and its theoretical basis (2,12,15). A plot of EXP log JMHVEH versus log SAQ (r2 = 0.94) gave a better fi t than a plot of EXP log JMHVEH versus log SVEH (r2 = 0.75), and a plot of EXP log JMHVEH versus log SOCT also gave a poor fi t (r2 = 0.52) (plots not shown). When estimated values of the coeffi cients obtained when SVEH was the independent vari- able in the fi t of the solubility, fl ux and MW data to RS were used to calculate log JMHVEH (CALC1 log JMHVEH) (Table II), the residual error for calculating log JMHVEH (Δ log JMHVEH = EXP log JMHVEH − CALC1 log JMHVEH) (Table II) was 0.178 ± 0.14 log units. Similarly, when the estimated values of the coeffi cients obtained when SAQ was the
Purchased for the exclusive use of nofirst nolast (unknown)
From: SCC Media Library & Resource Center (library.scconline.org)