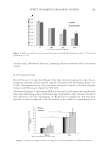
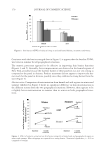
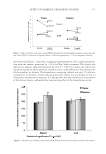
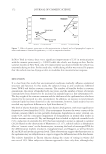
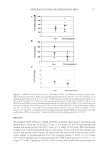
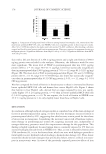
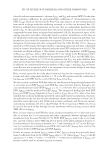
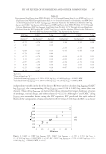
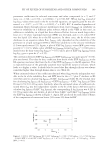
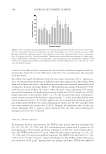
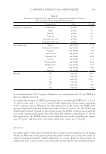
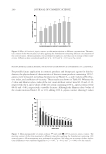
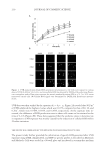
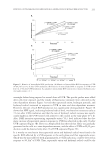
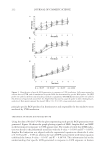
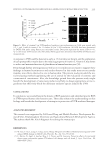
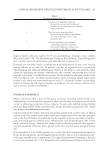
209 KINETICS OF UVB IRRADIATION-MEDIATED ROS GENERATION IN HUMAN KERATINOCYTES DHE (19–21) hydroxyl radical was determined by HPF (22) and hydrogen peroxide was determined by Amplex Red (23,24). After irradiation, the mixture of fresh serum-free and DCFH2-DA, DHE, HPF, and Amplex Red were immediately added to the cell and further incubated for specifi ed time intervals. Then, fl uorescence intensity was deter- mined using fl uorescence microplate reader (Beckton Dickinson, Rutherford, NJ), using a 488-nm excitation beam and a 520-nm band-pass fi lter for detecting DCFH2-DA- , using a 490-nm excitation beam and a 515-nm band-pass fi lter for HPF using a 488-nm excitation beam and a 610-nm band-pass fi lter for DHE and using a 530–nm excitation beam and a 590–nm band-pass fi lter for Amplex Red. The cell morphology was also vi- sualized under fl uorescence microscope. Nonirradiated cells were used as control. STATISTICAL ANALYSIS Data were shown as means ± SD from at least three or more independent experiments. Statistical analysis was performed using an analysis of variance (one-way analysis of vari- ance) and a post hoc test. A p value of less than 0.05 would be considered as statistically signifi cant. RESULTS KINETICS OF INTRACELLULAR ROS PRODUCTION IN HUMAN KERATINOCYTE CELLS IN RESPONSE TO UVB IRRADIATION Oxidative stress induced by UVB irradiation has been shown to be involved with many skin complications. However, the kinetics of ROS production in response to such radia- tion is poorly understood. To investigate the effect of UVB on the oxidative status of human keratinocytes, HaCaT cells were exposed to several doses of UVB (0–100 J/m2), and time-dependent elevation of intracellular ROS (0–6 h) was performed using ROS- specifi c probe. Figure 1A shows a time-dependent accumulative ROS signal in the cells. Importantly, UVB irradiation caused a dramatic increase in the rate of ROS accumulation in a dose-dependent manner with approximately 1.75-fold ROS induction detected in the 90 J/m2-treated cells compared to the nontreated control at 6 h. In response to UVB irritation, the induction of ROS signal was detected as early as 1 h after treatment. Such an increase of oxidative stress in keratinocytes was found to be in a dose-dependent man- ner up to 90 J/m2 of UVB, whereas a further increase of UVB doses resulted in the reduc- tion of ROS production (data not shown). Also, the ROS signal represented by an increase of intracellular DCF fl uorescence signal is shown in fl uorescence microphotographs in Figure 1B. It was very interesting that the rate of ROS production in the UVB-treated cells appeared to be accelerated in the fi rst 2-h period in comparison to that of control cells and then decreased to the level of basal ROS generation afterward (2–6 h). These kinetics data sug- gested that UVB-mediated intracellular oxidative stress in an early phase (~2 h) after an exposure to the UVB. We further evaluated the rate of ROS production in these cells in these two distinguished phases and found that the pattern of ROS induction rate was fi t to the linear trend line with R2 0.97 (Figures 2A and B). The rate constant (k) of each

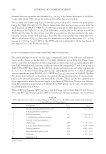
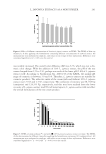
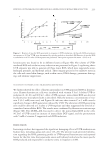
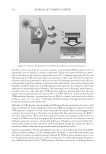
JOURNAL OF COSMETIC SCIENCE 210 UVB dose was then verifi ed by the equation of y = k0t + y0. Figure 2A revealed that 90 J/m2 of UVB exhibited the highest k value which was 0.6376, compared to that of 60, 40, and 0 J/m2, which were 0.5484, 0.5054, and 0.2695, respectively. As the exposure time in- creased, the difference of ROS production rate in these cells seems to be minimal at the time of 2–6 h (Figure 2B). These data suggested that the oxidative stress in keratinocyte in response to UVB exposure was mainly caused by the induction of cellular ROS within 2 h after irritation. THE SPECIFIC ROS GENERATED BY UVB EXPOSURE IN HUMAN KERATINOCYTE CELL The present study further provided the information of specifi c ROS generated after UVB exposure using DHE, Amplex Red, and HPF as specifi c probes as described in Materials and Methods. Cells were seeded in a 96-well plate and incubated in a serum-free medium Figure 1. UVB-induced intracellular ROS generation in keratinocytes. (A) Cells were exposed to various doses of UVB (0–90 J/m2) for 0–6 h, and intracellular ROS was detected by DCFH2-DA probe using fl uores- cence microplate reader. Data point represent the mean ± standard deviation (SD) (n = 4), *p 0.05 versus nontreated control cells. (B) Cellular ROS signal were determined by DCFH2-DA fl uorescence measure- ments.
Purchased for the exclusive use of nofirst nolast (unknown)
From: SCC Media Library & Resource Center (library.scconline.org)