JOURNAL OF COSMETIC SCIENCE 122 INTRODUCTION The tactile perception of substances is a personal physiological experience that varies from observer to observer and is dependent on the local sensory/nerve structures of the individual (1). Moreover, other perceptions, such as vision and smell or wishful thinking, may subconsciously bias the tactile experience. For this reason, panels of experts are often used to objectify tactile observations. Even the most expert panelist, however, cannot cleanly sort out the rheological contributions to the tactile experience. How these experi- ences add up to the observer’s impressions will vary between panelists no matter what precautions are taken to ensure objectivity. When rheological techniques are applied to complex fl uids, they most often provide a collection of individual parameters that feed into discerning neat material properties, rather than expressing the full spectrum of physiological challenges from the in vivo tactile experience. For this reason, rheological outcomes are often not intuitive, or do not fully describe palpable differences in the sensorial experience. We propose to leverage specifi c rheological techniques that close the gap in understanding measurable contributions infl uencing textural properties, while implicitly arguing that perhaps a less complex, “one-pot” visualization of an array of rheological properties more succinctly elucidates distinctions in the complex textural properties of substances. Successfully correlating textural properties with rheological properties involves a thor- ough understanding of the strengths and weaknesses of the measurement, as well as an appreciation for the tactile perception limits and complexity of the human somatosensory system—where signals from pressure, skin stretch, vibration, itch, and/or temperature are translated from touch via specialized sensory organs in the skin to the spinal cord and, fi nally, to the brain for processing (2). Further, and to complicate matters, applying cer- tain topical products to the skin may alter specifi c surface properties, thereby altering the mechanical stimulation of the skin (3). Although the biology of the individual is essen- tially fi xed, training the human to duplicate the restricted motions of a rheometer or texture analyzer, or confi guring the instrumentation to mimic the methodology of the sensorial challenge, is a valid option. Even more complex, each person’s biology and in- terpretation of perception is unique, leading to a natural bias in the panel data. Further, the unmistakable reality is that not all instrumental outputs relate to discernible senso- rial properties and, understandably, no single result resolutely defi nes the complex gamut of end-use textural appeal. Malcolm Bourne summarizes this emblematically by noting that there are many measurable wavelengths of electromagnetic radiation, but only select wavelengths between 400 and 700 nm (i.e., visible light) are perceptible basically, many instrumental techniques detect physical properties in materials that are not necessarily discernible by the somatic senses (4). Although daunting, many researchers have attempted sensorial correlations with the am- bition of developing predictive measurement models to mitigate the potential subjectiv- ity, sizeable cost, and time demands of using trained professional panelists for sizeable sensorial studies on cosmetic formulations (5–8). Many have focused on using parameters from fl ow models, such as the power law, or the yield stress and consistency parameters of the viscoplastic Herschel–Bulkley or Casson relationships (9). Some have focused on SAOS parameters to gauge the initial spreadability, cushion, or body of a structured sys- tem, while the 2010 work by Greenaway found the correlation of fi rmness, thickness, and the resistance and diffi culty of spreading with trends in the elastic modulus at high strain (10) others have focused on combining rheological and texture analyses to make paral-

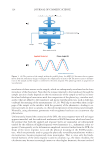
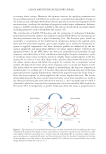
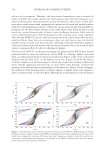
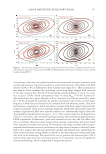
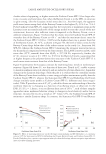
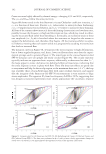
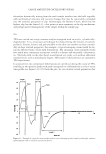
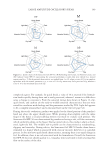
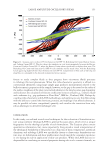
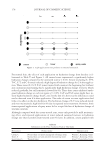
LARGE AMPLITUDE OSCILLATORY SHEAR 123 lels (8,11). Prior work also included sensorial correlations with discrete Fourier transform (DFT) and Chebyshev polynomials derived from LAOS experiments correlations included initial spreading, pick up, and cushion for a series of anionic hydrogels (12). In the current study, SAOS and fl ow methodologies were performed on texture proto- types to better understand the impact of viscosity, frequency, yield stress, thixotropy, and nonlaminar fl ow on the shapes of the Lissajous plots however, the principal objective of this work was to investigate the parallels between sensorial texture ratings and the trajec- tories of the Lissajous loops as a sample is deformed rotationally from the linear viscoelas- tic region (LVR) to large strains and high oscillatory shear rates using dynamic strain sweep experiments. Within the LVR, the loop trajectory mostly represents the at-rest state, whereas at very high strains, the Lissajous fi gures present a transition to a fl owing structured fl uid. Manipulating the resultant nonlinear Lissajous data enables decomposi- tion of the data into additional descriptive parameters. For example, performing DFT on the data subsequently enables conversion of the time-based (or temporal) stress response to the frequency domain. The population of each harmonic term in the frequency distri- bution is, hence, derived from the nonlinear stress-wave shape. The insights provided by this decomposition are refl ected in the introduction of additional Lissajous curves that track the trajectory of the elastic component of stress as a function of strain or shear rate. Thus, a formulator may better understand how the component of stored energy (or the energetic wish to fi ght back against the will of the forced rotation) infl uences the magni- tude of the total stress and the quality of the sensorial experience. SAOS TO LAOS AND THE RESULTING LISSAJOUS PLOTS Traditional dynamic oscillatory shear testing (SAOS) is conventionally applied to materi- als to determine a material’s at-rest microstructural properties, such as the magnitudes of the frequency-dependent elastic modulus [G’(ω)], loss modulus [G”(ω)], complex viscos- ity [η*(ω)], and tan delta [tan δ(ω)]. SAOS properties are studied in the LVR, where the driving forces that restore the structure stem from thermal energy (i.e., Brownian motion). In traditional oscillatory testing using a strain-controlled rheometer, a sinusoidal shear- ing strain is applied to the sample, and the sinusoidal stress response is simultaneously measured with the torque transducer (see wave interaction in Figure 1). Elastic samples exhibit no shift in phase (δ) between the applied strain and the measured stress response, whereas viscous samples have a phase shift of 90°. Viscoelastic materials, which comprise both viscous and elastic properties, exhibit phase shifts ranging from 0° to 90° between the absolute value of the stress (σ) and strain (γ) maxima. Imagine 45°–90° to be a visco- elastic liquid (G’ G”), where 45° is a 1:1 balance of elastic and viscous stress (G’ = G”), and 0°–45° to be a viscoelastic solid (G’ G”). For clarity, note that the term “sinusoidal” refers to the shape of the wave that is obtained by plotting strain as a function of time (t) in the following parametric equation: ( ) γ γ ωt(1),) 0 = sin( t where ω is the angular frequency (in rad/s) of the applied strain. Figure 1 implies the interplay between the applied strain, which is imparted by an oscillating motor, and the
Purchased for the exclusive use of nofirst nolast (unknown)
From: SCC Media Library & Resource Center (library.scconline.org)