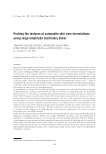
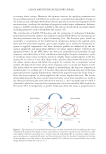
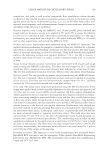
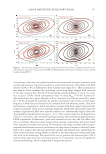
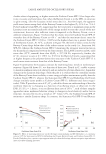
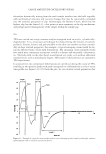
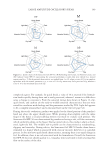
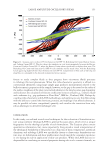
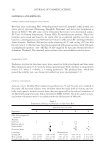
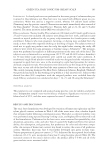
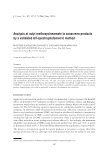
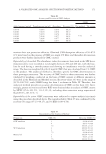
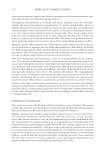
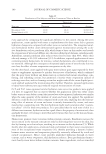
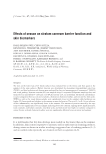
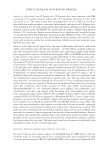
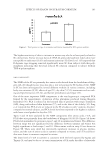
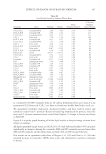
JOURNAL OF COSMETIC SCIENCE 124 translation of these stresses to the sample, which are subsequently transferred to the force transducer of the rheometer. Note that the torque imparted to the transducer through the sample junction clearly depends on the microstructure of the sample as well as its inter- facial and tribological association with the composition of the plates (e.g., stainless steel, acrylic) that are affi xed to the transducer and motor. Interfacial factors, such as wall slip, confound the meaning of the measurements (13,14). Wall slip occurs when there is slip- page of the sample at the interface with the geometry of the rheometer—leading to er- roneous results or, more accurately, to a fl awed interpretation of microstructural strength. Normally, using rheometer geometries with roughened surfaces can circumvent slip phenomena. Unfortunately, beyond the constraints of the LVR, the stress response wave will no longer appear sinusoidal, and the traditional mathematical SAOS functions, which are based on the premise that both the applied and response waves are sinusoidal, are subsequently tainted by the addition of higher frequency wave harmonics (i.e., anharmonic stress re- sponse). Consequently, as the deformation amplitude traverses further from the LVR, the shape of the stress response wave and the physical meaning of the SAOS parame- ters, which are primarily used to gauge the physically reversible perturbations within a microstructure, become progressively more meaningless. That is, since only the funda- mental harmonic of the stress response is used to calculate, e.g., the elastic modulus, the calculation may become increasingly inexact as other higher harmonics become involved Figure 1. (A) The position of the sample within the parallel plates. An ARES G2 rheometer has a separate motor from the transducer design to mitigate the complexities of inertia. (B) The motor exerts a deforma- tion on the sample and the torque is converted to the stress response. The phase lag relates to properties of viscoelasticity.

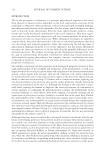
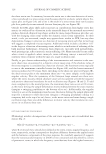
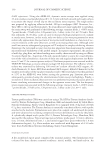
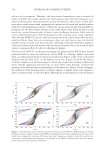
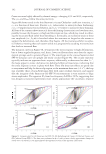
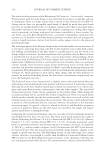
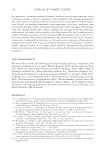
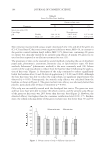
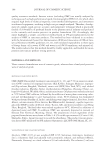
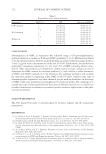
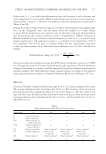
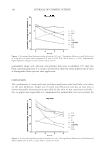
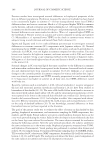
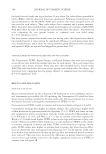
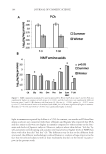
LARGE AMPLITUDE OSCILLATORY SHEAR 125 in storing elastic energy. Moreover, the primary motives for applying nondestructive forces and deformations in SAOS are to study time- or temperature-dependent changes in the material and, although the Hookean domain provides a mechanical fi ngerprint of the microstructure, studying the rheological properties under larger, anharmonic deforma- tions (i.e., LAOS) correlates more suitably to the end use of structured viscoelastic fl uids, including properties such as breakdown and texture (15). The introduction of LAOS, FT-rheology and the utilization of orthogonal Chebyshev polynomials potentially address and augment standard SAOS theory by introducing ad- ditional parameters that have a physical meaning (16). The Lissajous plots, which are essentially a visualization of the mathematical interference between the applied strain wave and the stress wave response, give visual insights into a material’s mechanical re- sponse to applied temperature and shear. Lissajous profi les are infl uenced by the fre- quency, amplitude, and initial phase difference (see phase angle in Figure 1) between the superposed waves. In the LVR, where the waves are sinusoidal and essentially of equal frequency, and where there is little contribution from higher frequency harmonics, a plot of oscillatory stress versus oscillatory strain for a highly elastic sample appears in the Lis- sajous plot as a line or a very thin ellipse with a positive slope (where the minor axis of the ellipse centers above and below the origin). In contrast, for a completely viscous sample, the shape of the stress versus strain Lissajous curve is circular (see Figure 2). Ide- ally, unless there are issues with the sample or methodology, the loops are symmetrical around strain = 0, or shear rate = 0, because the positive Cartesian trajectory of the loop represents positive angular displacement, whereas the negative trajectory of the loop re- fl ects the stress response to strain applied in the reverse angular direction. The inverse relationship between the stress versus strain and stress versus shear rate plots is a result of the shear rate (γ) being the time derivative of strain [i.e., γ(t) = γ0sin(ωt) and γ = dγ/dt = γ0ωcos(ωt), where the cosine and sine trigonometric functions naturally differ in phase by π/2 rad or 90°]. Consequently, in perfect Newtonian fl ow, the stress is proportional to Figure 2. The transition of a strain-based Lissajous plot to a shear rate–based trajectory infl uences the visual meaning of the diagram. If a sample is elastic, a plot of stress versus strain results in a line (A) however, if the same sample is plotted versus shear rate, a circular trajectory will emerge (B). A viscoelastic sample will ap- pear as an ellipse as it contains both elastic and viscous character. Note: In the elastic Lissajous plot, the slope of the semimajor axis of the ellipse is the complex modulus (G*), and the area is proportional to the average energy dissipated within the cycle (i.e., G”).
Purchased for the exclusive use of nofirst nolast (unknown)
From: SCC Media Library & Resource Center (library.scconline.org)