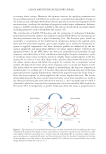
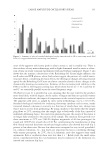
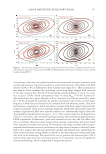
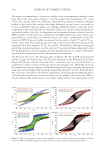
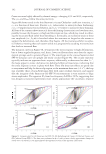
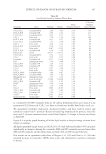
JOURNAL OF COSMETIC SCIENCE 140 150%. In contrast, in the stress sweeps, the Refreshing Gel Cream τ0 result was 371% higher in magnitude than Sunscreen Gel SPF-50, and implicitly notes the time depen- dence of the microstructural response, as well as the impact of viscoelasticity on the cor- responding apparent yield behavior. The Buttery Cream. It is a system that behaves very differently in the jar than on the skin. Examining the Lissajous contour plot at 25°C (Figure 4C) and using smooth or rough plate surfaces, the Buttery Cream sample shows the highest stress of the four textures up to 150 s-1, after which the structure begins to soften and, subsequently, the total stress pla- teaus. Comparing the higher shear rate data of the Buttery Cream to the Cushion Cream SPF-15, the total stress maxima are similar, but the Cushion Cream SPF-15 shows much more apparent elasticity, as noted by its wider contours at moderate-to-high oscillation shear strain rates (50–350 s-1). There appears to be some time needed for measurement equilibration of the Buttery Cream, as per the striations and gradual stress decay for each iteration at a particular strain (see inset of Figure 4C), which was paralleled by standard rheological methods for evaluating thixotropy (i.e., preshear and recovery, steady tor- sional). By using a marker to visually follow the deformation within the sample gap, it was shown that at 25°C the sample plug fl ows, meaning that the sample slips at both walls of the discs instead of laminarly deforming hence, the total stress plateaus because the energy of the motor is no longer fully translated to the entirety of the sample. Further, as noted from comparisons of smooth and rough surfaces data, wall slip and plug fl ow affect the tilt and maxima of the smooth-surface Lissajous loops. It appears that generated slip layers lead to lubricity and increased plug fl ow. For the Buttery Cream, the generation of slip layers is an important factor in correlating rheology with sensory perception. Temperature has a large impact on the fi rmness and spreadability of the Buttery Cream (Figure 6C). In fact, the Buttery Cream appears to melt onto the skin almost immedi- ately, showing that for structured waxes it is key to study rheology at the temperature pertinent to the application (e.g., skin = 32°–35°C) (18). At 32°C, the stress at maxi- mum shear strain rate drops by 302 Pa, meaning that the amount of apparent viscoelas- ticity decreases signifi cantly on transition from ambient to the skin surface temperature the same directionality is seen in the trends in σ’ (elastic stress) as a function of shear rate. Figures 7A and B show that at 32°C, the level of the apparent (i.e., slip affected) elastic stress for the Buttery Cream drops below that of the Sunscreen Gel SPF-50, meaning that the elasticity of the Buttery Cream microstructure, even at low shear rates, is signifi cantly softer than it is at 25°C. The G”/G’ crossover and σ’0 yield stress results (25°C, smooth) from high-shear LAOS (394/293 Pa, respectively) suggest that the yield magnitudes from LAOS are three to four times higher than the standard stress sweep result (τ0 = 92 Pa) and that at low strains (γ 3.7%) and short times, the waxy, crystalline microstructure is quite strong. Further, near the yield, higher oscillatory shear rates and the inability for the microstructure to relax may suppress inherent wall slip effects—thereby leading to a more accurate probing of the at-rest waxy microstructure. The Cushion Cream SPF-15. The Cushion Cream SPF-15 and Buttery Cream have similar stress maxima in their fi nal Lissajous loops (25°C, Figure 4C, and D, respectively) how- ever, looking at the low shear rate data from smooth and rough surfaces (Figure 5C and D) shows that the Buttery Cream at 25°C has more initial elasticity than the Cushion Cream SPF-15. Interestingly, evaluating the σ’ and σ” data versus strain for both systems

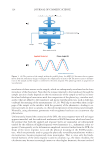
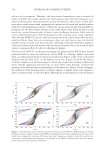
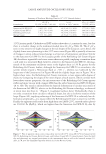
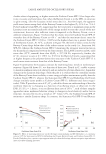
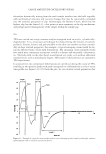
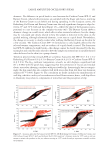
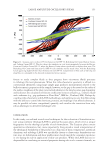
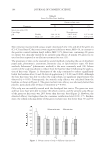
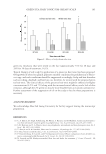
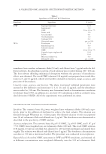
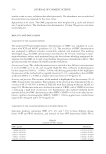
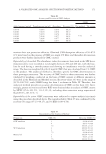
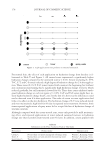
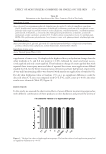
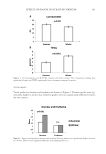
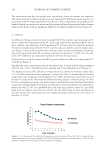
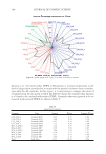
LARGE AMPLITUDE OSCILLATORY SHEAR 141 clarifi es what is happening at higher strains the Cushion Cream SPF-15 has larger elas- ticity, viscosity, and total stress but, when the Buttery Cream is in the LVR, its structure is quite strong. Like the Lissajous initial stress data (i.e., fi rst few loops), the apparent yield stress (stress sweep data) of the Buttery Cream is also higher (τ0: 92 ± 6 vs. 76 ± 4 Pa for Cushion Cream SPF-15), suggesting that the total stress at maximum strain in the Lissajous is not necessarily indicative of the energy needed to start the cascade of the mi- crostructure however, after suffi cient strain is imparted to the Buttery Cream, even at ambient temperature, Figure 7A shows that the elastic stress for Cushion Cream SPF-15 overtakes that of the Buttery Cream at 50 s-1 and that the maximum elastic stress for the Cushion Cream SPF-15 (509 vs. 358 Pa) at the highest shear rate is greater than that of the Buttery Cream. At 32°C, as shown in Figure 7B, the level of elastic stress for the Buttery Cream drops below that of the softest texture in the study (i.e., Sunscreen Gel SPF-50), whereas the Cushion Cream SPF-15 maintains the strongest microstructure in the hierarchical comparison between the four textures. The LAOS crossover and σ’0 yield stress data (25°C, smooth) show that σ0/σ’0 = 457/338 Pa, respectively further, the G”/G’ crossover occurs at γ = 138% (vs. 9.9% for the Buttery Cream), suggesting that at higher frequency the polymer-driven fi ne structure of the Cushion Cream SPF-15 is much more strain resistant than that of the Buttery Cream. Figure 8 summarizes the Lissajous contours by examining basic trends in nonlinear pa- rameters. Figure 8A shows G’L as a function of shear rate. Trends in G’L enable a means to monitor nonlinear intracycle elasticity, and are indicative of strain (shear rate)–dependent changes in the Lissajous loop shape. From the plot it is evident that the crystalline matrix of the Buttery Cream loses its ability to store energy at higher strains more quickly than the Cushion Cream SPF-15 whereas the Sunscreen Gel SPF-50 and Refreshing Gel Cream change similarly (same profi le as Cushion Cream SPF-15, different total stress magni- tudes). Table II provides a ratio of G’L/G’M, which facilitates an understanding of how the nonlinear elasticity is changing as a function of oscillating strain, or shear rate. In the LVR, G’L/G’M = 1 hence, at an oscillatory shear rate of 185 s-1, each of these samples approaches more nonlinear behavior owing to changes in local elasticity and/or loss in structure. As noted by G’L/G’M trends at 25° versus 32°C, the Cushion Cream SPF-15 maintains a similar Lissajous shape. In contrast, the Sunscreen Gel SPF-50 and Buttery Figure 8. Effect of increasing shear rate on the (A) large strain modulus and (B) Chebyshev v3/v1 intensity ratios at 32°C for Sunscreen Gel SPF-50, Refreshing Gel Cream, Buttery Cream, and Cushion Cream SPF-15. For the Chebyshev plot, a positive sign suggests intracycle shear thickening, whereas a negative sign indicates intracycle shear thinning processes.
Purchased for the exclusive use of nofirst nolast (unknown)
From: SCC Media Library & Resource Center (library.scconline.org)