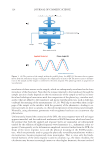
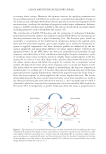
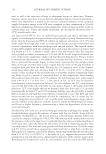
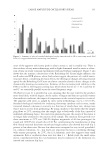
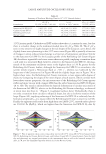
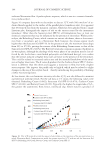
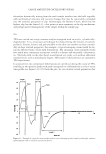
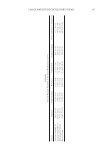
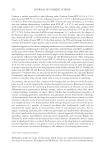
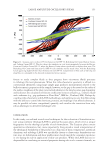
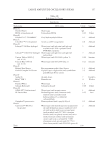
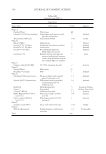
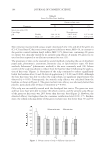
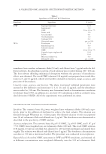
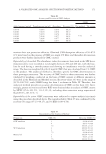
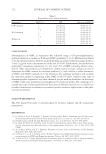
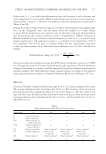
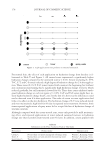
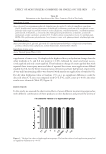
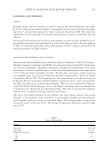
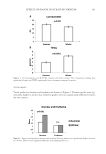
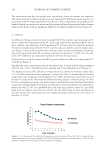
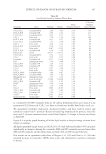
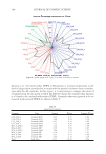
EFFECTS OF SEASON ON STRATUM CORNEUM 197 is a saturated C30-NP ceramide with an 18 carbon α-hydroxy fatty acid, C22_0 is an unsaturated C22 fatty acid, C18_1 is a fatty acid with one double bond (oleic acid), etc. We quantifi ed ceramides, cholesterol, cholesterol sulfate, and fatty acids in winter and summer in tapes 6 and 7 (pooled). Results of lipids log normalized for protein, sorted by ratio and % increase summer/winter sorted from highest % change to lowest are shown in Table III. Figure 8 is a spider graph showing all of the lipid results as the percentage increase from winter to summer. All lipids quantifi ed except stearic acid (C18_0) (+2%) and cholesterol sulfate (-6%) increased signifi cantly in summer. Among the ceramides, EOS and NP ceramides increased more than AH and AS ceramides, and the short-chain ceramide A16_0_S18 increased the least. Our results are in agreement with those of Rogers et al. (15) and Conti et al. (16) who reported increase in ceramide 1 (EOS), fatty acids, and cholesterol in summer compared to winter. Table III Lipid Results Sorted by Summer:Winter Ratio Ceramide Class Summer Winter Ratio (Summer:Winter) % Increase (Summer versus Winter) C30_C18_2 Ceramide-EOS 2.08 0.95 2.19 119 N30_0_P18 Ceramide-NP 5.06 2.34 2.17 117 C32_C18_1 Ceramides-EOS 0.23 0.11 2.11 111 C18_2 Fatty acid 2.78 1.39 2.00 100 N28_0_P18 Ceramide-NP 9.11 4.57 1.99 99 C32_C18_2 Ceramide-EOS 1.11 0.56 1.99 99 C16_1 Fatty acids 4.16 2.13 1.95 95 N26_0_P18 Ceramide-NP 6.38 3.31 1.93 93 C24_0 Fatty acids 45.87 24.25 1.89 89 N24_0_P18 Ceramide-NP 6.59 3.56 1.85 85 Cholesterol Sterol 284.17 156.44 1.82 82 C30_C18_1 Ceramide-EOS 0.31 0.17 1.82 82 C18_1 Fatty acids 9.52 5.27 1.80 80 Ceramides Ceramides-all 43.37 24.16 1.79 79 P18 Sphingosine bases 1.56 0.88 1.78 78 A26_0_P18 Ceramide-AP 1.28 0.72 1.77 77 A24_0_P18 Ceramide-AP 0.93 0.52 1.77 77 C14_0 Fatty acids 6.07 3.44 1.76 76 C22_0 Fatty acids 12.94 7.45 1.74 74 N24_0_DS18 Ceramide-NDS 1.46 0.87 1.67 67 N26_0_DS18 Ceramide-NDS 2.90 1.85 1.57 57 Sphingoid bases Sphingosine bases 3.23 2.10 1.54 54 TOTAL FA Fatty Acids-All 153.89 104.98 1.47 47 A26_0_H18 Ceramide-AH 2.30 1.67 1.38 38 DS18 Sphingosine bases 0.39 0.29 1.36 36 S18 Sphingosine bases 1.19 0.90 1.32 32 C16_0 Fatty acids 34.84 26.56 1.31 31 A24_0_H18 Ceramide-AH 1.23 0.96 1.28 28 A16_0_S18 Ceramide-AS 1.50 1.31 1.14 14 C18_0 Fatty acids 29.62 29.07 1.02 2 Cholesterol-SO4 Sterol-sulfate 9.63 10.19 0.94 -6

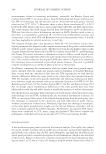
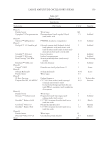
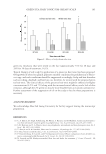
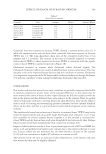
JOURNAL OF COSMETIC SCIENCE 198 Figure 8. Spider graph of SC lipids, % increase in winter to summer. Janssens et al. (72) reported that TEWL in AD patients is inversely proportional to the level of longer chain ceramides but increases with the presence of shorter chain ceramides, especially the AS ceramides. In this respect, it is interesting to compare the ratios of ceramides from the data given in Table III. Table IV shows the ceramides that Janssens et al. found to be correlated with reduced TEWL. Ceramides that were reported to be as- sociated with increased TEWL are shown in Table V. Table IV Long Chain Ceramides Ceramide Class Summer Winter Summer:Winter C30_C18_1 Ceramide-EOS 0.31 0.17 1.82 C30_C18_2 Ceramide-EOS 2.08 0.95 2.19 C32_C18_1 Ceramides-EOS 0.23 0.11 2.09 C32_C18_2 Ceramide-EOS 1.11 0.56 1.98 N24_0_DS18 Ceramide-NDS 1.46 0.87 1.68 N24_0_P18 Ceramide-NP 6.59 3.56 1.85 N26_0_DS18 Ceramide-NDS 2.90 1.85 1.57 N26_0_P18 Ceramide-NP 6.38 3.31 1.93 N28_0_P18 Ceramide-NP 9.11 4.57 1.99 N30_0_P18 Ceramide-NP 5.06 2.34 2.16 Total Long chain 35.23 18.29 1.93
Purchased for the exclusive use of nofirst nolast (unknown)
From: SCC Media Library & Resource Center (library.scconline.org)