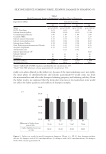
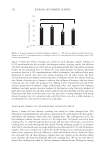
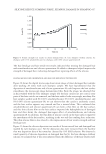
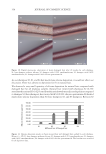
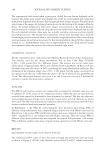
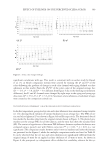
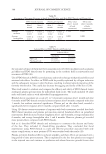
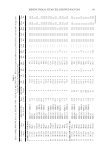
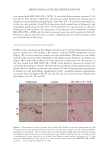
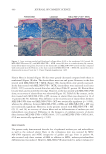
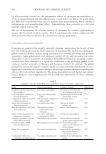
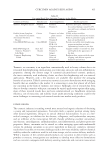
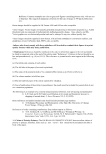
368 JOURNAL OF COSMETIC SCIENCE The experimental task started when a participant clicked the start button displayed on the monitor. Two white-noise images were displayed for 1,000 ms, and standard and comparison stimuli were displayed after the noise. The background of the images was grey. The participant selected one of the images by clicking a button located at the bottom of the stimuli. After the choice, the stimuli disappeared, white-noise images were presented at the stimuli position, and the next pair of stimuli selected using the staircase method were displayed side by side. For each standard stimulus, there were two initially ascending staircases and two initially descending staircases. The standard and comparison stimuli were presented twice, with the left and right positions reversed. Hence, each stimulus image was evaluated four times during staircase sessions. In each staircase session, the first trial started from the end of the comparison stimuli set, i.e., darkest/whitest sclera color or largest/smallest eye size. Each staircase session was terminated when the staircase direction was reversed eight times. EXPERIMENTAL CONDITIONS All the experiments were conducted at the Odawara Research Center of Kao Corporation. The monitor used for the image presentation was an Eizo Color Edge CG243W (1,920 × 1,200 pixels) (Eizo Inc., Hakusan, Japan). The monitor was set up under room illumination of approximately 400 lx and calibrated with ColorMunki (X-Rite) such that the white point was 100 cd m−2 at D65, considering the room illumination conditions. The resolution of the stimulus image was 1,700 × 2,129 pixels, but the image was resized on the monitor such that the width from the chin to the top of the head was approximately 21 cm. The observation distance was set at 1 m, and a chin rest was set at 1 m from the monitor to control the observation conditions. ANALYSIS The PSE of each staircase session was computed by averaging the stimulus value (eye size or lightness L* of the sclera) of the comparison stimuli, where the staircase direction was reversed from upward to downward or from downward to upward. The first two responses were excluded because of large errors caused by missed clicks, and only the latter six points were used. The PSE of each standard stimulus was determined by averaging the PSE of four sessions conducted with each standard stimulus. In Experiment 1, the PSEs for each participant were measured, and average PSEs of different eyeliner thicknesses were compared using a paired t-test with Holm’s correction. In Experiment 2, the average PSEs of different eyeliner colors were compared to baseline (eye size 100% /original L*) by a one-sample t-test with Holm’s correction. Here, the average PSEs of different colors of the eyeliners were not compared. In contrast, in Experiment 3, the average PSEs of different eyeliner colors were compared using a paired t-test with Holm’s correction. RESULTS MEASUREMENT OF THE SCLERA COLOR CHANGE WITH AGE The measured L*a*b* values of the sclera were averaged and plotted for each age band, as shown in Figure 5. All the color channels, particularly L* and b*, exhibit statistically

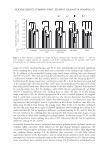
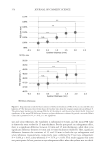
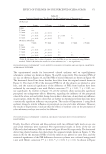
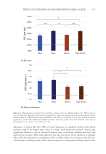
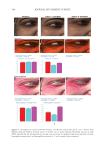
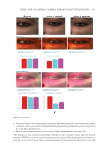
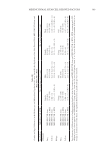
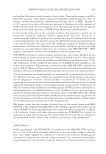
369 EFFECT OF EYELINER ON THE PERCEIVED SCLERA COLOR significant correlations with age. This result is consistent with an earlier study by Russel et al. (7), in which comparison stimuli were created by varying the L* and b* of the sclera following the gradient of change in each color channel with aging (defined as sclera whiteness in this study). From the L*a*b* of the sclera color of the original average face (L* =47.4, a* =3.8, and b* =8.7, different from Figure 5 due to the shooting environment difference), the L* and b* channels were changed by eight steps in the aging and young age directions (L* =37.6–57.2, b* =5.5–11.9). Seventeen sclera-whiteness–modulated images were created as the comparison stimuli set. PSYCHOPHYSICAL EXPERIMENT 1: BLACK EYELINER WITH THICKNESS VARIATION In the first experiment, perceptual eye size and sclera whiteness were examined using stimulus set 1 by drawing black eyeliners of various thicknesses on an average face. The PSEs of eye size and sclera lightness L* are shown in Figure 6A and B, respectively. The horizontal dotted line marks the baseline (data from the original stimuli shown in Figure 3). The plotted grey markers are the average PSEs for all the subjects, and the error bars show the standard error (SE). The statistical significance of the mean PSE difference between eyeliner thicknesses was evaluated using a paired t-test with Holm’s correction (**:p 0.01, *:p 0.05, n.s.: not significant). The comparison results between only 0 mm (no eyeliner) and other thicknesses are presented in the Figure 6, while the multiple comparison results are listed in Table II. It can be observed that the eye size and sclera whiteness are significantly different from the original image (0 mm) for an applied eyeliner thickness of 1.0 mm or more. As shown in Figure 6, the perceptual eye enlargement effect exhibits less variability, whereas for the eye Figure 5. Sclera color change with age.
Purchased for the exclusive use of nofirst nolast (unknown)
From: SCC Media Library & Resource Center (library.scconline.org)