176 JOURNAL OF COSMETIC SCIENCE
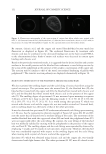
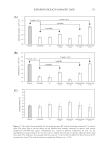
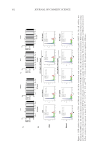
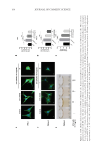
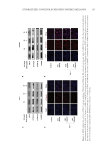
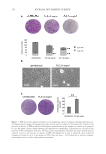
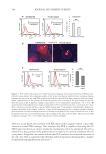
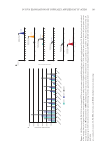
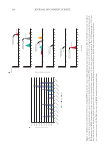
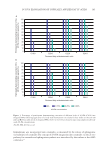
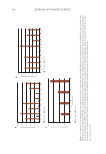
Figure 1. PLE slows down growth and protects the amplifying capacity of human epidermal keratinocytes.
(A) Representative images of clonogenicity assays of keratinocytes cultured at low density for 10 days in the
presence or absence of PLE as indicated. Histogram: quantification of the number of colonies in A, grouped
by size (B) phase contrast images showing the representative morphology of keratinocytes cultured in the
presence of PLE (0.8mg/ml). Scale bar: 100 µm and (C) representative clonogenicity assays of keratinocytes
cultured or not in the presence or absence of PLE (0.8 mg/ml) for 8 days as indicated, then seeded for
clonogenicity assays as in A, in the absence of PLE. Data are mean ± SD of duplicate or triplicate samples,
representative of two to three independent experiments.
Figure 1. PLE slows down growth and protects the amplifying capacity of human epidermal keratinocytes.
(A) Representative images of clonogenicity assays of keratinocytes cultured at low density for 10 days in the
presence or absence of PLE as indicated. Histogram: quantification of the number of colonies in A, grouped
by size (B) phase contrast images showing the representative morphology of keratinocytes cultured in the
presence of PLE (0.8mg/ml). Scale bar: 100 µm and (C) representative clonogenicity assays of keratinocytes
cultured or not in the presence or absence of PLE (0.8 mg/ml) for 8 days as indicated, then seeded for
clonogenicity assays as in A, in the absence of PLE. Data are mean ± SD of duplicate or triplicate samples,
representative of two to three independent experiments.