180 JOURNAL OF COSMETIC SCIENCE
However, in our hands the treatment with PLE induced these signals without a detectable
increase of actual DNA damage. This indicates that PLE is capable of boosting the G2
DNA repair machinery in a direct manner by mechanisms still to be elucidated. The p53 is
referred to as the guardian of the genome due to its capacity to correctly coordinate the cell
cycle phases. Altogether, our results indicate that PLE reinforces the orchestral execution of
the cell cycle. This is consistent with the lower index of expression of keratin K16, a marker
of epidermal hyperproliferation and stress.34
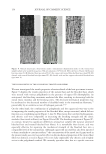
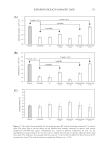
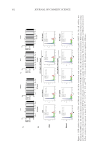
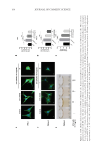
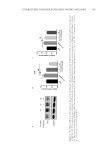
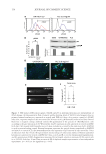
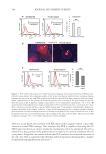
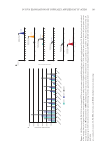
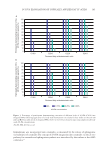
Figure 4. PLE reduces the proportion of keratinocytes undergoing stress-induced terminal differentiation.
(A) Left, representative flow cytometry profiles of the levels of involucrin (solid red line) in primary human
keratinocytes treated or not with PLE, as indicated, for 8 days. Dotted black line is negative antibody control.
Right, quantification of the percent of involucrin-positive cells according to the gate shown on the left.
Data are mean ± SD of duplicate samples representative of two independent experiments. **p 0.01 (B)
representative immunofluorescence images of untreated or PLE-treated keratinocytes, as indicated, for 5 days.
Red is involucrin (arrows) and blue is nuclear DNA stained with 4′,6-diamidino-2-phenylindole. Broken line
outlines the border of the colonies. Scale bar: 50 µm and (C) representative flow cytometry profiles of keratin
K16 expression (red line) in human keratinocytes treated or not with PLE for 8 days. Dotted line as in A. Bar
histogram shows the percent of K16-positive cells according to the gate in the left plots. Data are mean ± SD
of duplicate samples. **p 0.01. FLH1: Fluorescence channel 1 Height.
However, in our hands the treatment with PLE induced these signals without a detectable
increase of actual DNA damage. This indicates that PLE is capable of boosting the G2
DNA repair machinery in a direct manner by mechanisms still to be elucidated. The p53 is
referred to as the guardian of the genome due to its capacity to correctly coordinate the cell
cycle phases. Altogether, our results indicate that PLE reinforces the orchestral execution of
the cell cycle. This is consistent with the lower index of expression of keratin K16, a marker
of epidermal hyperproliferation and stress.34
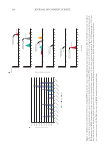
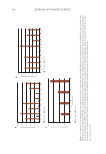
Figure 4. PLE reduces the proportion of keratinocytes undergoing stress-induced terminal differentiation.
(A) Left, representative flow cytometry profiles of the levels of involucrin (solid red line) in primary human
keratinocytes treated or not with PLE, as indicated, for 8 days. Dotted black line is negative antibody control.
Right, quantification of the percent of involucrin-positive cells according to the gate shown on the left.
Data are mean ± SD of duplicate samples representative of two independent experiments. **p 0.01 (B)
representative immunofluorescence images of untreated or PLE-treated keratinocytes, as indicated, for 5 days.
Red is involucrin (arrows) and blue is nuclear DNA stained with 4′,6-diamidino-2-phenylindole. Broken line
outlines the border of the colonies. Scale bar: 50 µm and (C) representative flow cytometry profiles of keratin
K16 expression (red line) in human keratinocytes treated or not with PLE for 8 days. Dotted line as in A. Bar
histogram shows the percent of K16-positive cells according to the gate in the left plots. Data are mean ± SD
of duplicate samples. **p 0.01. FLH1: Fluorescence channel 1 Height.