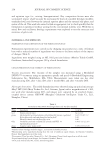
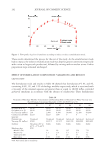
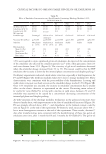
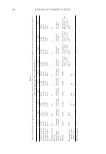
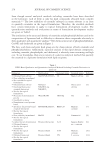
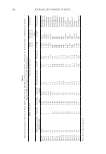
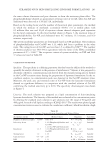
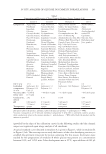
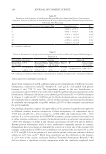
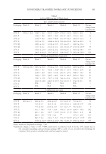
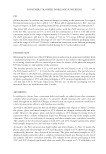
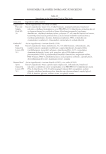
Table
II
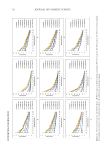
The
Chromatographic
Conditions
of
Trials
Mobile
Phase
System,
Flow
Rate
and
Injection
Volume,
and
Results
the
Retention
Times,
Tailing
Factors,
and
the
Number
of
Theoretical
Plates
of
Cer-NP
Chromatograms
HPLC
conditions
Retention
time
(min)
Tailing factor
Number
of theoretical plates
Suitability
Mobile
phase
system (MeOH:ACN)
Flow
rate
Stationary phase
Injection volume
Phosphatidylcholine
Cer-NP
Cholesterol
Cer-NP
Cer-NP
Peak
quality
Trial
1
10:0
1
C18
100
5.7
6.3
8.3
1.162
320.7
Peak
depletion
Trial
2
9:1
1
C18
100
4.9
6.7
8.6
1.336
2569.6
Peak
depletion
Trial
3
8:2
1
C18
100
6.7
7.3
9.1
1.169
5969.9
Overlapping
Trial
4
7:3
1
C18
100
7.1
8.2
9.9
2.693
1257.1
Overlapping
Trial
5
6:4
1
C18
100
7.3
8.9
10.4
1.383
4759.4
Unqualified
Trial
6
9:1
0.8
C18
80
6.6
ND
8.4
ND
ND
Peak
depletion
Trial
7
9:1
0.8
C18
50
6.4
ND
8.2
ND
ND
Peak
depletion
Trial
8
9:1
0.8
C18
10
6.4
ND
8.1
ND
ND
Peak
depletion
Trial
9
9:1
0.5
C18
80
10.3
ND
13.2
ND
ND
Overlapping
Trial
10
9:1
0.5
C18
50
10.3
ND
13.1
ND
ND
Overlapping
Trial
11
9:1
0.5
C18
10
10.4
ND
13.2
ND
ND
Overlapping
Trial
12
6:4
0.8
C18
80
6.9
8.4
10.3
1.303
3594.0
Suitable
Trial
13
6:4
0.8
C18
50
6.6
8.1
9.9
ND
ND
Unqualified
Trial
14
6:4
0.8
C18
10
6.9
8.9
10.3
1.258
5983.8
Suitable
Trial
15
6:4
0.5
C18
80
10.5
13.1
15.9
ND
ND
Unqualified
Trial
16
6:4
0.5
C18
50
10.5
13.0
15.8
0.851
3792.8
Suitable
Trial
17
6:4
0.5
C18
10
10.7
13.5
15.8
1.194
5913.4
Suitable
Trial
17’
6:4
0.5
C8
10
11.6
ND
ND
1.067
ND
Peak
depletion
Note:
ND
=
Not
determined.
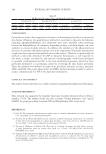
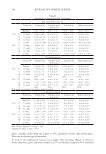
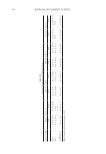
280 JOURNAL OF COSMETIC SCIENCE
II
The
Chromatographic
Conditions
of
Trials
Mobile
Phase
System,
Flow
Rate
and
Injection
Volume,
and
Results
the
Retention
Times,
Tailing
Factors,
and
the
Number
of
Theoretical
Plates
of
Cer-NP
Chromatograms
HPLC
conditions
Retention
time
(min)
Tailing factor
Number
of theoretical plates
Suitability
Mobile
phase
system (MeOH:ACN)
Flow
rate
Stationary phase
Injection volume
Phosphatidylcholine
Cer-NP
Cholesterol
Cer-NP
Cer-NP
Peak
quality
Trial
1
10:0
1
C18
100
5.7
6.3
8.3
1.162
320.7
Peak
depletion
Trial
2
9:1
1
C18
100
4.9
6.7
8.6
1.336
2569.6
Peak
depletion
Trial
3
8:2
1
C18
100
6.7
7.3
9.1
1.169
5969.9
Overlapping
Trial
4
7:3
1
C18
100
7.1
8.2
9.9
2.693
1257.1
Overlapping
Trial
5
6:4
1
C18
100
7.3
8.9
10.4
1.383
4759.4
Unqualified
Trial
6
9:1
0.8
C18
80
6.6
ND
8.4
ND
ND
Peak
depletion
Trial
7
9:1
0.8
C18
50
6.4
ND
8.2
ND
ND
Peak
depletion
Trial
8
9:1
0.8
C18
10
6.4
ND
8.1
ND
ND
Peak
depletion
Trial
9
9:1
0.5
C18
80
10.3
ND
13.2
ND
ND
Overlapping
Trial
10
9:1
0.5
C18
50
10.3
ND
13.1
ND
ND
Overlapping
Trial
11
9:1
0.5
C18
10
10.4
ND
13.2
ND
ND
Overlapping
Trial
12
6:4
0.8
C18
80
6.9
8.4
10.3
1.303
3594.0
Suitable
Trial
13
6:4
0.8
C18
50
6.6
8.1
9.9
ND
ND
Unqualified
Trial
14
6:4
0.8
C18
10
6.9
8.9
10.3
1.258
5983.8
Suitable
Trial
15
6:4
0.5
C18
80
10.5
13.1
15.9
ND
ND
Unqualified
Trial
16
6:4
0.5
C18
50
10.5
13.0
15.8
0.851
3792.8
Suitable
Trial
17
6:4
0.5
C18
10
10.7
13.5
15.8
1.194
5913.4
Suitable
Trial
17’
6:4
0.5
C8
10
11.6
ND
ND
1.067
ND
Peak
depletion
Note:
ND
=
Not
determined.
280 JOURNAL OF COSMETIC SCIENCE