292 JOURNAL OF COSMETIC SCIENCE
photo studio, lying parallel to, and at 23 cm above the microstrips. Apart from the stable
lightning conditions, samples and standards had to be in the same photo for reliable
quantification. It was also important that the microstrip wells were not placed right below
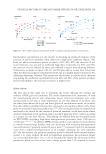
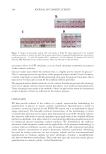
the light source, to minimize glare. RGB image analysis was subsequently performed
using the image editing software ImageJ.17 The selected region of interest was typically
around 1,500–2,200 square pixels, around the center of the well to avoid reflection
from microstrip material in the edges. Any subregion within the selected central area
having a bubble or glare was not taken into account upon picture analysis. The values
of the Red, Green, Blue, Hue, Saturation, and Brightness channels were plotted against
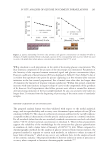
glucose concentration. The blue component color was optimum upon image analysis of
the opaque emulsions and the transparent shampoo studied, while the green component
color intensity was superior in the case of translucent gel analysis. Based on the group’s
experience, optimum monitoring channel might depend on cosmetic formula or even
picture quality.
RESULTS AND DISCUSSION
METHOD PRINCIPLE AND OPTIMIZATION
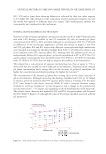
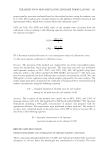
We here present the application of a new analysis setup for glucose quantification in a
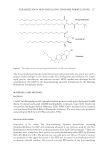
broad range of cosmetic matrices. Quantification relied on exogenous addition to the
emulsion/shampoo/gel of a commercially available, buffered mixture of GOD, POD and
appropriate cofactors and chromogens (GOD/POD WR), to yield a colored end product,
according to the widely established GOD/POD chromogenic reaction.11 Indeed, in the
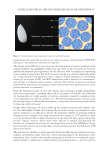
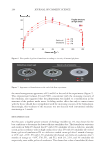
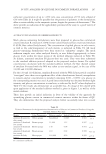
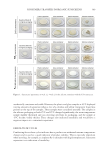
presence of glucose, pink/red coloration of the cosmetic product was achieved, which was
minimal at zero glucose concentration. To demonstrate the suitability of the approach
for quantitative glucose analysis in cosmetic formulations, a glucose-free O/W emulsion
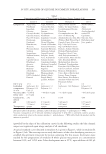
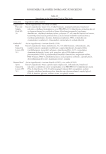
was prepared (“emulsion B”). The emulsion composition (ingredients at concentrations
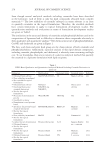
above 0.001% w/w) and certain properties are available in Table I. The emulsion was free
of any natural extracts, to avoid glucose presence. Aliquots of the emulsion were spiked
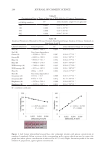
with increasing glucose concentrations between 0.0 and 20*10−3% w/w to yield suitable
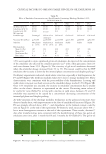
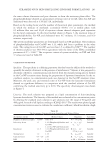
standards. After the addition of the GOD/POD WR at various amounts per gram of
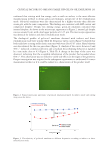
emulsion (as shown in Table II) at 25°C, the resulting colored emulsions were loaded
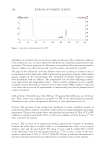
onto microstrip wells. A picture of the wells was captured by a smartphone camera, and
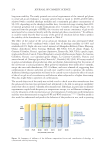
different channel outputs were recorded. Table II data show that addition of 642 µL of
WR/g emulsion is sufficient to provide a wide enough linear dynamic range without
compromising goodness of fit. This relative amount of WR was used in all subsequent
studies.
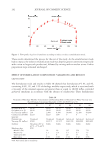
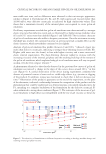
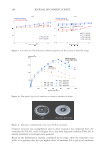
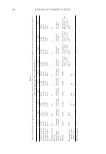
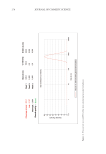
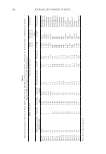
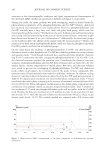
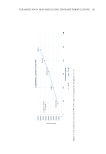
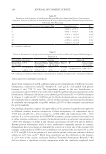
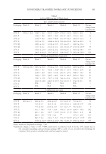
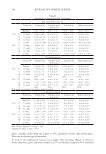
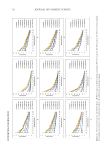
To select the optimum parameters for smartphone-based measurements, calibration graphs
were constructed in two opaque O/W emulsions of different viscosity, oil content, and
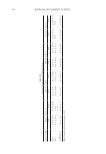
conductivity, emulsion B and emulsion A (composition in Table I). Parameters of the
linearity of the response between measured signal and glucose concentration (equation,
Pearson’s coefficient of determination (R2) and linear dynamic range) were determined in
the RGB and HSB color spaces, by the ImageJ application.17 The analytical parameters
registered are provided in Table III. Based on Table III data, it appears that the blue channel
output is the optimum to follow for both emulsions, since it presents better goodness of fit
(higher R2 value), in combination with a wide enough linear range and increased sensitivity
photo studio, lying parallel to, and at 23 cm above the microstrips. Apart from the stable
lightning conditions, samples and standards had to be in the same photo for reliable
quantification. It was also important that the microstrip wells were not placed right below
the light source, to minimize glare. RGB image analysis was subsequently performed
using the image editing software ImageJ.17 The selected region of interest was typically
around 1,500–2,200 square pixels, around the center of the well to avoid reflection
from microstrip material in the edges. Any subregion within the selected central area
having a bubble or glare was not taken into account upon picture analysis. The values
of the Red, Green, Blue, Hue, Saturation, and Brightness channels were plotted against
glucose concentration. The blue component color was optimum upon image analysis of
the opaque emulsions and the transparent shampoo studied, while the green component
color intensity was superior in the case of translucent gel analysis. Based on the group’s
experience, optimum monitoring channel might depend on cosmetic formula or even
picture quality.
RESULTS AND DISCUSSION
METHOD PRINCIPLE AND OPTIMIZATION
We here present the application of a new analysis setup for glucose quantification in a
broad range of cosmetic matrices. Quantification relied on exogenous addition to the
emulsion/shampoo/gel of a commercially available, buffered mixture of GOD, POD and
appropriate cofactors and chromogens (GOD/POD WR), to yield a colored end product,
according to the widely established GOD/POD chromogenic reaction.11 Indeed, in the
presence of glucose, pink/red coloration of the cosmetic product was achieved, which was
minimal at zero glucose concentration. To demonstrate the suitability of the approach
for quantitative glucose analysis in cosmetic formulations, a glucose-free O/W emulsion
was prepared (“emulsion B”). The emulsion composition (ingredients at concentrations
above 0.001% w/w) and certain properties are available in Table I. The emulsion was free
of any natural extracts, to avoid glucose presence. Aliquots of the emulsion were spiked
with increasing glucose concentrations between 0.0 and 20*10−3% w/w to yield suitable
standards. After the addition of the GOD/POD WR at various amounts per gram of
emulsion (as shown in Table II) at 25°C, the resulting colored emulsions were loaded
onto microstrip wells. A picture of the wells was captured by a smartphone camera, and
different channel outputs were recorded. Table II data show that addition of 642 µL of
WR/g emulsion is sufficient to provide a wide enough linear dynamic range without
compromising goodness of fit. This relative amount of WR was used in all subsequent
studies.
To select the optimum parameters for smartphone-based measurements, calibration graphs
were constructed in two opaque O/W emulsions of different viscosity, oil content, and
conductivity, emulsion B and emulsion A (composition in Table I). Parameters of the
linearity of the response between measured signal and glucose concentration (equation,
Pearson’s coefficient of determination (R2) and linear dynamic range) were determined in
the RGB and HSB color spaces, by the ImageJ application.17 The analytical parameters
registered are provided in Table III. Based on Table III data, it appears that the blue channel
output is the optimum to follow for both emulsions, since it presents better goodness of fit
(higher R2 value), in combination with a wide enough linear range and increased sensitivity