294 JOURNAL OF COSMETIC SCIENCE
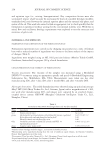
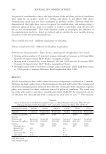
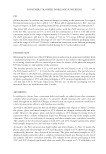
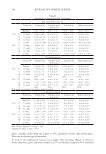
Table II
Optimization Data in Terms of Amount of WR Added/g of Cosmetic Preparation
μL WR/g emulsion R2 Linear dynamic range (%w/w glucose)
100 0.993 0.00–1.43*10−3
186 0.980 0.00–2.29*10−3
445 0.998 0.00–4.96*10−3
642 0.994 0.00–7.50*10−3
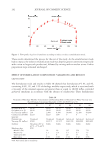
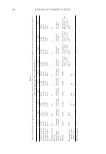
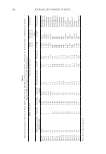
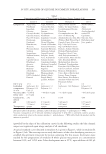
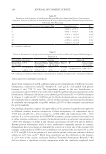
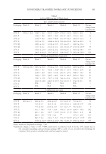
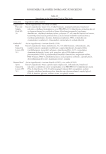
Table III
Analytical Parameters Obtained for Various Channels Upon Digital Image Analysis of Glucose Standards in
Emulsions A and B
Channel (emulsion) Linear Equation R2 Linear Dynamic Range (%w/w glucose)
Red (A) −2406x +199.5 0.962 0.00–6.37*10−3
Red (B) Poor linear dependence
Green (A) −10990x +193.8 0.987 0.00–6.37*10−3
Green (B) −8400x +180.8 0.991 0.00–7.08*10−3
Blue (A) −8976x +201.2 0.992 0.00–6.37*10−3
Blue (B) −7869x +170.9 0.994 0.00–7.50*10−3
RGB average (A) −7410x +198.0 0.992 0.00–6.37*10−3
RGB average (B) −5657x +185.9 0.990 0.00–7.08*10−3
Hue (A) 1602x +230.9 0.892 1.82–6.37*10−3
Hue (B) Poor linear dependence
Saturation (A) 11411x +16.7 0.989 0.00–6.37*10−3
Saturation (B) 5764x +44.6 0.972 0.14–7.50*10−3
Brightness (A) −2479x +200.4 0.986 0.00–8.00*10−3
Brightness (B) −1045x +209.5 0.833 0.63–7.50*10−3
R2: correlation coefficient.
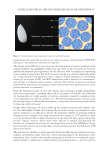
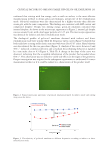
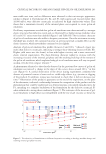
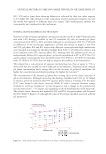
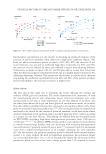
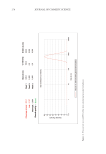
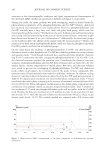
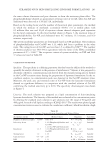
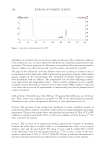
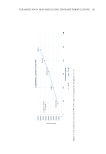
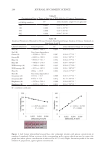
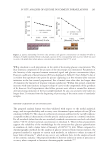
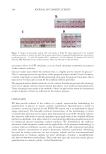
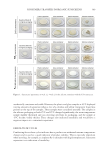
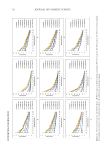
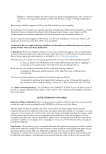
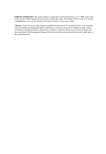
Figure 1. Left: Linear relationship between blue color component intensity and glucose concentration in
emulsion A standards. Below, a picture of the corresponding wells is given, which was used to extract the
graph data (where glucose concentration is indicated (in 10−3% w/w)). Right: Saturation profile of the same
emulsion A preparations, against glucose concentration.
Table II
Optimization Data in Terms of Amount of WR Added/g of Cosmetic Preparation
μL WR/g emulsion R2 Linear dynamic range (%w/w glucose)
100 0.993 0.00–1.43*10−3
186 0.980 0.00–2.29*10−3
445 0.998 0.00–4.96*10−3
642 0.994 0.00–7.50*10−3
Table III
Analytical Parameters Obtained for Various Channels Upon Digital Image Analysis of Glucose Standards in
Emulsions A and B
Channel (emulsion) Linear Equation R2 Linear Dynamic Range (%w/w glucose)
Red (A) −2406x +199.5 0.962 0.00–6.37*10−3
Red (B) Poor linear dependence
Green (A) −10990x +193.8 0.987 0.00–6.37*10−3
Green (B) −8400x +180.8 0.991 0.00–7.08*10−3
Blue (A) −8976x +201.2 0.992 0.00–6.37*10−3
Blue (B) −7869x +170.9 0.994 0.00–7.50*10−3
RGB average (A) −7410x +198.0 0.992 0.00–6.37*10−3
RGB average (B) −5657x +185.9 0.990 0.00–7.08*10−3
Hue (A) 1602x +230.9 0.892 1.82–6.37*10−3
Hue (B) Poor linear dependence
Saturation (A) 11411x +16.7 0.989 0.00–6.37*10−3
Saturation (B) 5764x +44.6 0.972 0.14–7.50*10−3
Brightness (A) −2479x +200.4 0.986 0.00–8.00*10−3
Brightness (B) −1045x +209.5 0.833 0.63–7.50*10−3
R2: correlation coefficient.
Figure 1. Left: Linear relationship between blue color component intensity and glucose concentration in
emulsion A standards. Below, a picture of the corresponding wells is given, which was used to extract the
graph data (where glucose concentration is indicated (in 10−3% w/w)). Right: Saturation profile of the same
emulsion A preparations, against glucose concentration.