308 JOURNAL OF COSMETIC SCIENCE
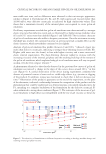
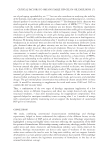
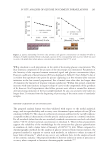
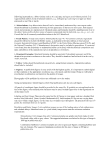
white, crumbly curdles while the sample at 45°C solidified to brittle, light brown plates.
This was an obvious sign of instability.
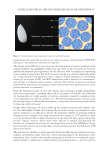
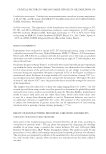
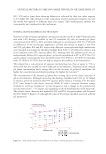
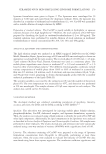
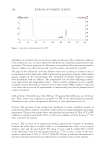
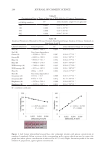
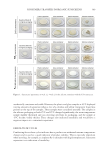
At week 0, the combination sunscreen was bright white and shiny (Figure 1). After 12
weeks, the plastic, glass, and metal samples at 25°C and the metal sample at 45°C remained
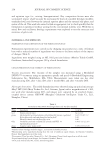
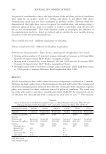
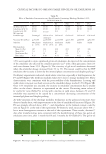
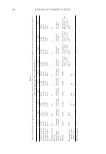
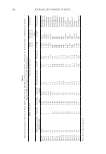
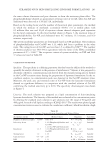
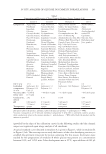
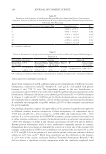
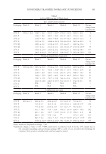
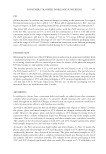
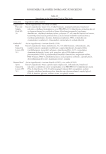
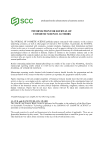
Table II
Spreadability of Sunscreen in Plastic Packaging
Zinc oxide-based sunscreen
Time point Firmness (g) Hardness work
done (g.sec)
Stickiness (g) Adhesiveness (g.sec)
Baseline 8.62 ± 0.15 8.96 ± 1.14 −5.93 ± 0.20 −0.08 ± 0.01
25°C P 12 weeks 9.49 ± 0.86 9.56 ± 0.17 −6.68 ± 1.20 −0.08 ± 0.00
G 12 weeks 10.43 ± 0.35 9.73 ± 0.36 −7.40 ± 0.23 −0.08 ± 0.00
M 12 weeks 9.23 ± 0.50 9.02 ± 0.23 −7.17 ± 0.76 −0.08 ± 0.00
S 4 weeks 71.91 ± 5.96* 42.27 ± 3.26* −53.83 ± 3.51* −84.51 ± 2.82*
45°C P 12 weeks 9.08 ± 3.01 9.60 ± 0.62 −5.98 ± 2.42 −0.06 ± 0.04
G 12 weeks 7.45 ± 0.71 9.51 ± 0.180 −5.52 ± 0.95 −0.08 ± 0.00
M 12 weeks 7.45 ± 1.10 9.94 ± 0.69 −5.12 ± 1.65 −0.09 ± 0.00
S 2 weeks 29.2 ± 4.76* 15.00 ± 2.02 −13.48 ± 2.23* −28.81 ± 2.99*
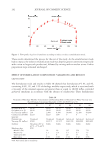
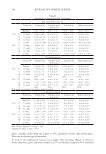
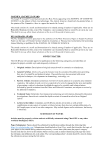
TiO2-based sunscreen
Time point Firmness (g) Hardness work
done (g.sec)
Stickiness (g) Adhesiveness (g.sec)
Baseline 5.97 ± 0.20 8.28 ± 0.34 −4.14 ± 0.23 −0.08 ± 0.00
25°C P 12 weeks 7.10 ± 1.56 9.40 ± 0.66 −3.70 ± 3.18 −0.08 ± 0.00
G 12 weeks 8.27 ± 1.15 9.31 ± 0.27 −5.62 ± 0.75 −0.08 ± 0.00
M 12 weeks 6.23 ± 0.16 9.79 ± 0.49* −2.87 ± 2.43 −0.08 ± 0.00*
S -N/A N/A N/A N/A
45°C P 12 weeks 8.66 ± 0.06 9.96 ± 0.16 −7.07 ± 0.64 −0.08 ± 0.00
G 12 weeks 13.05 ± 0.15* 9.96 ± 0.23* −8.54 ± 0.59* −0.08 ± 0.00*
M 12 weeks 10.92 ± 0.44* 9.85 ± 0.25 −6.81 ± 0.87 −0.08 ± 0.00*
S – N/A N/A N/A N/A
N/A: products solidified and could no longer be tested.
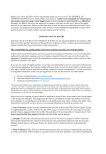
Combination sunscreen
Time point Firmness (g) Hardness work
done (g.sec)
Stickiness (g) Adhesiveness (g.sec)
Baseline 12.84 ± 0.50 7.91 ± 0.29 −8.57 ± 0.48 −0.08 ± 0.00
25°C P 12 weeks 12.40 ± 1.71 9.59 ± 0.03* −8.02 ± 0.79 −0.08 ± 0.00
G 12 weeks 11.71 ± 1.30 9.61 ± 0.27* −7.41 ± 0.87 −0.08 ± 0.00*
M 12 weeks 14.70 ± 1.91 9.34 ± 0.26* −9.53 ± 0.54 −0.08 ± 0.00*
S 4 weeks 22.08 ± 2.38* 13.68 ± 1.17* −15.33 ± 2.15* −17.62 ± 2.60*
45°C P 12 weeks 12.55 ± 4.21 9.29 ± 1.11 −7.89 ± 3.25 −0.08 ± 0.01
G 12 weeks 7.98 ± 2.38* 9.60 ± 0.11* −4.91 ± 1.94 −0.09 ± 0.00*
M 12 weeks 15.24 ± 2.52 9.72 ± 0.28* −7.75 ± 1.02 −0.08 ± 0.00*
S 2 weeks 8.74 ± 1.41 11.57 ± 0.04* −3.72 ± 2.63* −0.04 ± 0.00*
Note: Results displayed as average ± SD.
*Significant change, p value 0.05.
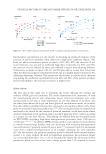
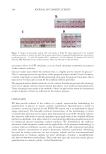
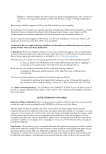
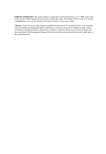
white, crumbly curdles while the sample at 45°C solidified to brittle, light brown plates.
This was an obvious sign of instability.
At week 0, the combination sunscreen was bright white and shiny (Figure 1). After 12
weeks, the plastic, glass, and metal samples at 25°C and the metal sample at 45°C remained
Table II
Spreadability of Sunscreen in Plastic Packaging
Zinc oxide-based sunscreen
Time point Firmness (g) Hardness work
done (g.sec)
Stickiness (g) Adhesiveness (g.sec)
Baseline 8.62 ± 0.15 8.96 ± 1.14 −5.93 ± 0.20 −0.08 ± 0.01
25°C P 12 weeks 9.49 ± 0.86 9.56 ± 0.17 −6.68 ± 1.20 −0.08 ± 0.00
G 12 weeks 10.43 ± 0.35 9.73 ± 0.36 −7.40 ± 0.23 −0.08 ± 0.00
M 12 weeks 9.23 ± 0.50 9.02 ± 0.23 −7.17 ± 0.76 −0.08 ± 0.00
S 4 weeks 71.91 ± 5.96* 42.27 ± 3.26* −53.83 ± 3.51* −84.51 ± 2.82*
45°C P 12 weeks 9.08 ± 3.01 9.60 ± 0.62 −5.98 ± 2.42 −0.06 ± 0.04
G 12 weeks 7.45 ± 0.71 9.51 ± 0.180 −5.52 ± 0.95 −0.08 ± 0.00
M 12 weeks 7.45 ± 1.10 9.94 ± 0.69 −5.12 ± 1.65 −0.09 ± 0.00
S 2 weeks 29.2 ± 4.76* 15.00 ± 2.02 −13.48 ± 2.23* −28.81 ± 2.99*
TiO2-based sunscreen
Time point Firmness (g) Hardness work
done (g.sec)
Stickiness (g) Adhesiveness (g.sec)
Baseline 5.97 ± 0.20 8.28 ± 0.34 −4.14 ± 0.23 −0.08 ± 0.00
25°C P 12 weeks 7.10 ± 1.56 9.40 ± 0.66 −3.70 ± 3.18 −0.08 ± 0.00
G 12 weeks 8.27 ± 1.15 9.31 ± 0.27 −5.62 ± 0.75 −0.08 ± 0.00
M 12 weeks 6.23 ± 0.16 9.79 ± 0.49* −2.87 ± 2.43 −0.08 ± 0.00*
S -N/A N/A N/A N/A
45°C P 12 weeks 8.66 ± 0.06 9.96 ± 0.16 −7.07 ± 0.64 −0.08 ± 0.00
G 12 weeks 13.05 ± 0.15* 9.96 ± 0.23* −8.54 ± 0.59* −0.08 ± 0.00*
M 12 weeks 10.92 ± 0.44* 9.85 ± 0.25 −6.81 ± 0.87 −0.08 ± 0.00*
S – N/A N/A N/A N/A
N/A: products solidified and could no longer be tested.
Combination sunscreen
Time point Firmness (g) Hardness work
done (g.sec)
Stickiness (g) Adhesiveness (g.sec)
Baseline 12.84 ± 0.50 7.91 ± 0.29 −8.57 ± 0.48 −0.08 ± 0.00
25°C P 12 weeks 12.40 ± 1.71 9.59 ± 0.03* −8.02 ± 0.79 −0.08 ± 0.00
G 12 weeks 11.71 ± 1.30 9.61 ± 0.27* −7.41 ± 0.87 −0.08 ± 0.00*
M 12 weeks 14.70 ± 1.91 9.34 ± 0.26* −9.53 ± 0.54 −0.08 ± 0.00*
S 4 weeks 22.08 ± 2.38* 13.68 ± 1.17* −15.33 ± 2.15* −17.62 ± 2.60*
45°C P 12 weeks 12.55 ± 4.21 9.29 ± 1.11 −7.89 ± 3.25 −0.08 ± 0.01
G 12 weeks 7.98 ± 2.38* 9.60 ± 0.11* −4.91 ± 1.94 −0.09 ± 0.00*
M 12 weeks 15.24 ± 2.52 9.72 ± 0.28* −7.75 ± 1.02 −0.08 ± 0.00*
S 2 weeks 8.74 ± 1.41 11.57 ± 0.04* −3.72 ± 2.63* −0.04 ± 0.00*
Note: Results displayed as average ± SD.
*Significant change, p value 0.05.