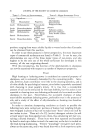
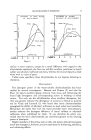
42 JOURNAL OF THE SOCIETY OF COSMETIC CHEMISTS measured. The pH was determined with a MacBeth pH meter and the surface tension with a DuNouy tensiometer. The specific gravity of each emulsion was taken, but in all cases there was so little variation that no conclusions could be drawn. The viscosity was measured with a Hoeppler Falling Ball Viscosimeter and the particle size distribution was observed microscopically. Dotts (1) reported a method of determining particle size distribution of insoluble powders and stated that the method could be applied to emulsions. This method consisted of the use of a sedimentation tube with a capillary tube connected in about the center of this tube. The capillary tube was filled with the same liquid as the external phase of the emulsion, the emul- sion placed in the sedimentation tube and the phases allowed to settle. The change in position of the dispersed phase changed the density slightly and allowed some of the liquid in the capillary tube to flow into the main tube. The rate of fall in the capillary tube could be measured and this is related to the rate of change in the main tube. The change there was due to the size of the internal phase so the rate of fall with time could be plotted on a graph and the particle size distribution calculated. Repro- ducible results could not be obtained with emulsions in this apparatus and this method was abandoned. After a survey of other methods of measuring particle size distribution, a microscopic method was used. This method consisted of gently mixing the emulsion to uniformly mix the phases, then placing four drops of emulsion in 200 cc. of distilled water. The emulsion was stirred and one drop of very dilute emulsion was placed on a slide, covered with a cover slip, and measured. The internal phase was sufficiently dispersed to allow measurement with the calibrated scale. This particular scale when used at a magnification of 430 diameters (43 X objective, 10X ocular) had a value of 1.8 microns per division. The drop- lets were brought under the scale and the diameter of the droplet could then be estimated. For each emulsion five separate slides were prepared as above and a minimum of 200 counts was taken from each slide so that at least 1000 droplets were measured for each emulsion. The diameters were arranged into classes of 2 microns and in this manner a percentage ratio of sizes could be obtained. The per cent of creaming was determined by pouring 100 cc. of each emulsion in cylindrical graduates, letting them stand at room temperature, and measuring the volume of separation after equilibrium was reached. This is recorded without consideration of the time needed to reach equi- librium, which varied considerably and is tabulated later. Table 1 shows a general comparison of the physical properties of the seven emulsions as determined twenty-four hours after their preparation. Three emulsions were made by each method, and the average for the three is given. [t can be seen from this table that, of the physical properties compared,

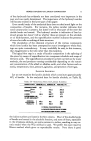
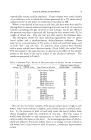
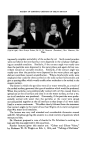
FACTORS ON THE FORMATION OF COSMETIC EMULSIONS 43 TABLE I--PHYsIOAL PROPERTIES OF EMULSIONS MADE BY DIFFERENT METHODS Method of Mixing 1 2 3 4 5 6 7 Temperature at time of emul- sifying (deg.) 75 75 75 75 75 30. 28 Te.mperature at end of stir- ring (deg.) 63 63 58 63 65 30 28 Viscosity (cps) 13 11.3 10.5 9.3 9.3 8.4 7.7 Surface tension (dynes) 38 38.3 36.3 38 37.8 37 37.1 Specific gravity .955 .957 .957 .960 .953 .955 .956 pH 5.95 5.88 6.00 5.63 5.85 5.75 5.63 Total creaming, % 54 37 58 45 62 55 53 viscosity of the emulsions has the widest variation, varying in the same formula from 7.7 cps to 13. It is interesting to note that, in this instance, at least, the percentage of creaming seemingly has no relationship or de- pendency on the viscosity, as the two extremes cited show only one per cent difference in their total creaming. Likewise, the other emulsions show no relationship between these two factors. The studies on particle size distribution were somewhat disappointing in that no clear cut relationship between particle size distribution and sta- bility could be determined. The emulsified particles were tabulated in ranges of 2 microns and in all cases but one, the highest percentage of par- ticles fell in the lowest range, below 1.9 microns. In all cases, the per cent of larger sized particles decreased directly with the increase in particle size. Table 2 shows the particle size distribution of each emulsion. TABLE 2--PARTIOLE SIZE DISTRIBUTION OF THE DIffERENT EMULSIONS (PER CENT) Particle Size Ranges (Microns) Below 10.0- 12.0 & Sample 1.9 2.0-3.9 4.0-5.9 6.0-7.9 8.0-9.9 11.9 above 1 58.4 20.3 5.5 4.1 2.6 1.3 7.8 2 53.8 23.9 7.5 4.2 2.7 1.4 6.5 3 42.2 24.0 10.1 5.9 3.8 2.7 11.3 4 46.3 29.3 10.0 5.0 3.3 1.3 4.8 5 57.0 22.6 5.2 3.0 2.6 1.8 7.8 6 37.3 24.5 12.3 8.8 4.9 2.5 9.7 7 23.6 43.6 18.4 6.5 3.3 0.7 3.9 While particle size plays a role in the stability of emulsions, there are most certainly other factors more influential, and considering the different techniques used in preparing this formula, there is a surprisingly little variation in the particle size distribution except in the last two preparations which were emulsified while cold. It would seem that the temperature of the mixture at the time it is emulsified, plays a role in the determination of particle size distribution. Figures 1, 2, and 3 are photomicrographs of the three emulsions showing the greatest difference in particle size distribu- tion.
Purchased for the exclusive use of nofirst nolast (unknown)
From: SCC Media Library & Resource Center (library.scconline.org)