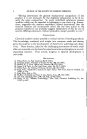
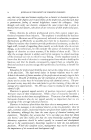
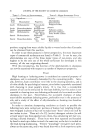
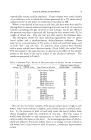
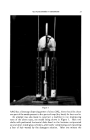
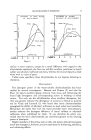
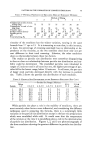
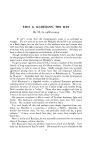
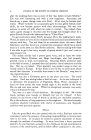
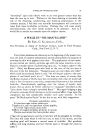
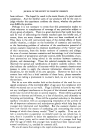
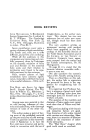
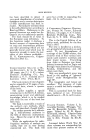
FACTORS ON THE FORMATION OF COSMETIC EMULSIONS 43 TABLE I--PHYsIOAL PROPERTIES OF EMULSIONS MADE BY DIFFERENT METHODS Method of Mixing 1 2 3 4 5 6 7 Temperature at time of emul- sifying (deg.) 75 75 75 75 75 30. 28 Te.mperature at end of stir- ring (deg.) 63 63 58 63 65 30 28 Viscosity (cps) 13 11.3 10.5 9.3 9.3 8.4 7.7 Surface tension (dynes) 38 38.3 36.3 38 37.8 37 37.1 Specific gravity .955 .957 .957 .960 .953 .955 .956 pH 5.95 5.88 6.00 5.63 5.85 5.75 5.63 Total creaming, % 54 37 58 45 62 55 53 viscosity of the emulsions has the widest variation, varying in the same formula from 7.7 cps to 13. It is interesting to note that, in this instance, at least, the percentage of creaming seemingly has no relationship or de- pendency on the viscosity, as the two extremes cited show only one per cent difference in their total creaming. Likewise, the other emulsions show no relationship between these two factors. The studies on particle size distribution were somewhat disappointing in that no clear cut relationship between particle size distribution and sta- bility could be determined. The emulsified particles were tabulated in ranges of 2 microns and in all cases but one, the highest percentage of par- ticles fell in the lowest range, below 1.9 microns. In all cases, the per cent of larger sized particles decreased directly with the increase in particle size. Table 2 shows the particle size distribution of each emulsion. TABLE 2--PARTIOLE SIZE DISTRIBUTION OF THE DIffERENT EMULSIONS (PER CENT) Particle Size Ranges (Microns) Below 10.0- 12.0 & Sample 1.9 2.0-3.9 4.0-5.9 6.0-7.9 8.0-9.9 11.9 above 1 58.4 20.3 5.5 4.1 2.6 1.3 7.8 2 53.8 23.9 7.5 4.2 2.7 1.4 6.5 3 42.2 24.0 10.1 5.9 3.8 2.7 11.3 4 46.3 29.3 10.0 5.0 3.3 1.3 4.8 5 57.0 22.6 5.2 3.0 2.6 1.8 7.8 6 37.3 24.5 12.3 8.8 4.9 2.5 9.7 7 23.6 43.6 18.4 6.5 3.3 0.7 3.9 While particle size plays a role in the stability of emulsions, there are most certainly other factors more influential, and considering the different techniques used in preparing this formula, there is a surprisingly little variation in the particle size distribution except in the last two preparations which were emulsified while cold. It would seem that the temperature of the mixture at the time it is emulsified, plays a role in the determination of particle size distribution. Figures 1, 2, and 3 are photomicrographs of the three emulsions showing the greatest difference in particle size distribu- tion.

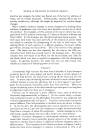
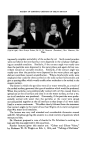
44 JOURNAL OF THE SOCIETY OF COSMETIC CHEMISTS .. :•,,.• o .• '•' .. •. , / • ? • ' " ß • -0 •" •:'% 0 • ? • • ' '• ....... •.•. .•'.'• ...... •:• -:-:• ..... • • 0.': •'•: . * •-' ::'• -:'-: ' Fig. l.•Photomicrograph of Emulsion No. 1 showing high percentage of smallest particles. As subsequent experimentation and measurements showed, the emulsion having the best properties and highest degree of stability did not show an appreciable difference in particle size distribution from the other products and we are reluctant to draw any definite conclusions from this phase of the work. After the measurements were completed, each emulsion was shaken and completely dispersed, and one hundred cc. was measured out in a cylindrical graduate and allowed to stand at room temperature. Another bottle of the emulsion was kept under the same conditions and these prod- ucts were observed regularly for evidence of change of any nature. The only noticeable changes were, of course, the creaming of the products. A considerable difference in the rate of creaming became apparent almost immediately, and the time required for each emulsion to complete its creaming was determined. These times varied from 72 hours to one week. The rates of creaming differed also in that emulsion No. 3 showed an almost immediate creaming while emulsion No. 2 showed none until 20 hours later. For comparative purposes, photographs of the emulsions at the start and finish of creaming are shown in Figs. 4 and 5. It is very apparent that the method of making an emulsion affects both
Purchased for the exclusive use of nofirst nolast (unknown)
From: SCC Media Library & Resource Center (library.scconline.org)