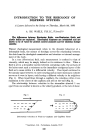
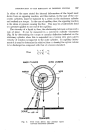
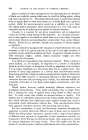
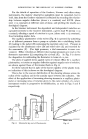
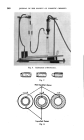
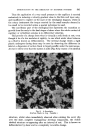
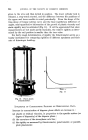
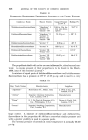
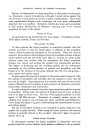
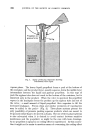
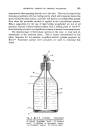
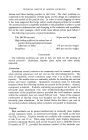
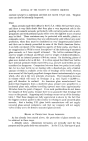
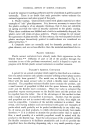
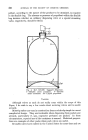
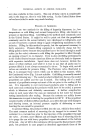
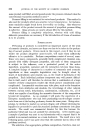
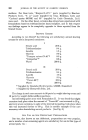
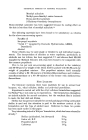
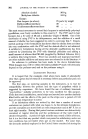
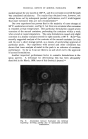
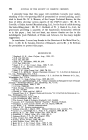
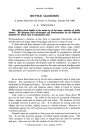
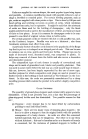
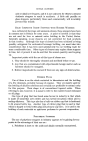
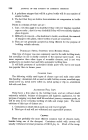
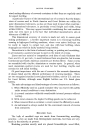
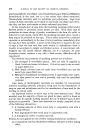
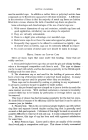
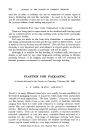
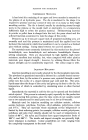
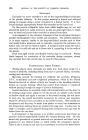
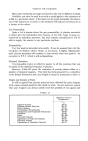
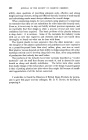
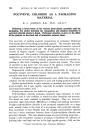
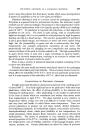
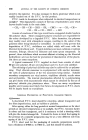
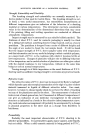
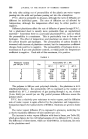
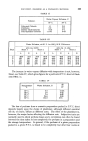
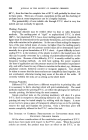
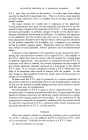
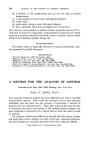
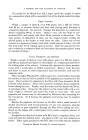
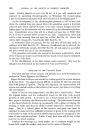
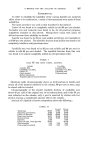
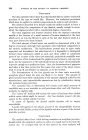
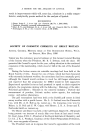
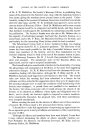
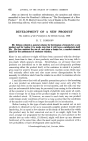
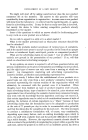
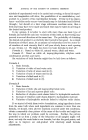
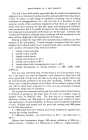
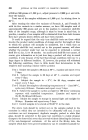
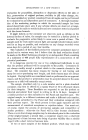
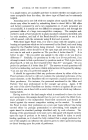
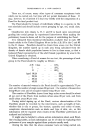
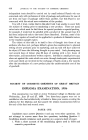
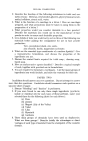
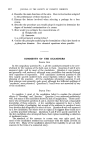
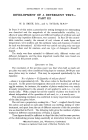
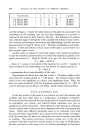
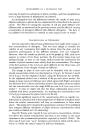
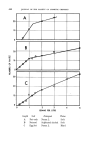
INTRODUCTION TO THE RHEOLOGY OF DISPERSE SYSTEMS 339 For the details of operation of the Goodeve, Stormer and other rotary instruments, the makers' descriptive pamphlets must be consulted, but in brief, data from the Goodeve viscometer is obtained by recording the relation- ship between angular deflection (stress X a constant) and R.P.M. (shear rate) X (a constant) at different rates of shear, and plotting the results as a rheological diagram. In the Stormer instrument the dependent and independent variables are operated inversely to the Goodeve instrument, a given load W (stress) X (a constant), effecting a speed of rotation in r.p.m. (shear rate) X (a constant), thus furnishing similar data. The capillary plastometer ot the writer (Fig. 4) is operated by admitting air at different pressures from a pump or cylinder into a stabilising bottle (B) leading to the jacket (H) containing the material under test. Pressure is regulated by the admittance valve (D) and relief valve (E) and recorded by the manometer (F). (For high pressures, a dial manometer is more con- venient.) Efflux velocities at different (decreasing) pressures are read on the flowmeter manometer (L) comprising the air-leak (K). In Fig. 5 is shown the disposition for calibrating the flowmeter in terms oi c.c./sec. The plots of applied stress against rates of volume effiux for a capillary plastometer, or torsion as angular deflection against angular rate oi rotation, are shown against those of Newtonian fluids in Fig. 6. It will be noticed that in spite of the known rigidity of the plastic body, no indication of this is shown on the rheological diagram. This is due to the uneven distribution of the shearing stresses across the radius of the capillary and in the annular space between the cylinders. The effect oi the application of increasing shearing stresses in a capillary plasto- meter or increasing rates of rotation given to the outer cylinder of a rotary instrument results in progressive de-solidification, as seen in Figs. 7 and 8 respectively. Fig. 4. Schematic lay-out of Plastometer. Shear rate Fig. 6.

340 JOURNAL OF THE SOCIETY OF COSMETIC CHEMISTS Fig. 5. Calibration of Flowmeter. Fig. 7. Non-liquefied Zones Liquefied Zones Fig. 8.
Purchased for the exclusive use of nofirst nolast (unknown)
From: SCC Media Library & Resource Center (library.scconline.org)