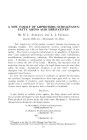
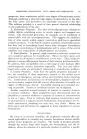
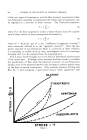
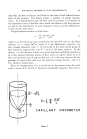
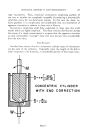
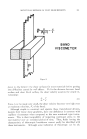
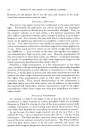
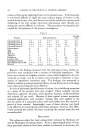
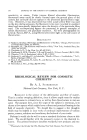
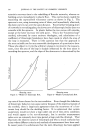
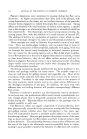
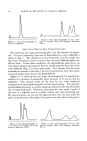
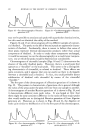
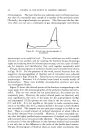
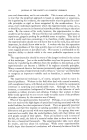
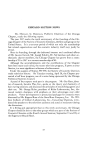
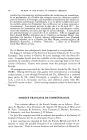
ROTATIONAL METHODS OF FLOW MEASUREMENTS 295 IO B o I 5 5 SHEARING STRESS IN DYNES/CM a X II• s Figure 9. of long relaxation time which appears most prominently in the low shear region. The effects of these relationships are more clearly discernible from Figs. 9 and 10. These are high shear curves produced on the Asbeck High Shear Viscometer (16) and low shear curves, measured with the modified Bergen (14) Viscometer, respectively, of two commercial hand creams. As can be seen from the high shear curves, which extends to about 10,000 sec. -• both materials show a thixotropic hysteresis loop. However, Sam- ple B has a considerably higher viscosity at the practical commercial ap- plication shear velocities than sample A. Furthermore, B possesses con- siderably more structure with a relatively short relaxation time than A, which appears almost NewtonJan. It is interesting to note that repeat runs on the same batch of material eliminate the hysteresis loops, and sub- sequent up and down curves lie on the down curve produced on the first run. A number of pertinent points are well illustrated with these two high shear curves. One of the most important is the futility of attempting to obtain generally valid viscosity data from single point viscosity measurements if the material is not previously known. Thus, although curve .4 could be approximated with extrapolations from a single point measurement be- cause of its reasonably close approach to NewtonJan behavior at high shear

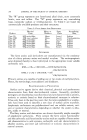
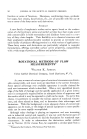
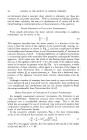
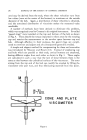
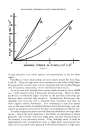
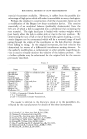
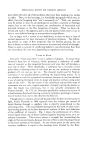
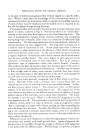
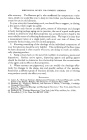
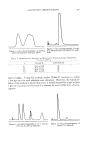
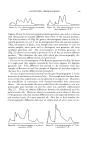
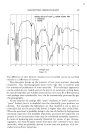
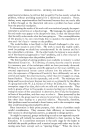
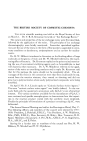
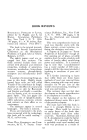
296 JOURNAL OF THE SOCIETY OF COSMETIC CHEMISTS B I 0 I0 20 SHEARING STRESS IN DYNES/CU Figure 10. rates, curve B would give meaningless results for any extrapolations from single point measurements over its entire length. The other important factor previously stressed which is often disre- garded in practical viscosity measurements is also well illustrated by these curves. This is the necessity of covering sufficiently large shear ranges to accommodate the materials. Curve B is a particularly good example of this point. Were measurement of the material stopped at 500 to 1000 sec. -• shear velocity, a completely erroneous picture of the viscosity at the ap- plication shear rates would result, with apparent values some four or five times higher than actually present. This misleading condition may also work in the direction of low shear rates. Thus, from the high shear curves, extrapolation into the zero axes would indicate that sample A is almost Newtonian and has a maximum low shear viscosity of about 1.8 poise and B of about 5.5 poise. The low shear viscosity curves of these two samples, however, give a completely different picture. Far from being almost NewtonJan, sample A shows a very considerable structure with viscosities in the very low shear range in excess of several thousand poise. Sample B shows even greater structure than A, and a substantial stress is required to overcome the initial resistance to flow.
Purchased for the exclusive use of nofirst nolast (unknown)
From: SCC Media Library & Resource Center (library.scconline.org)