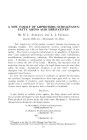
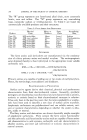
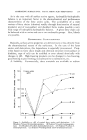
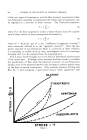
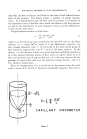
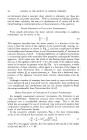
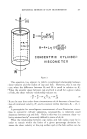
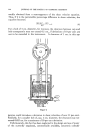
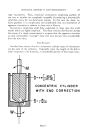
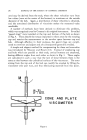
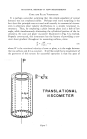
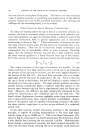
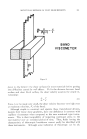
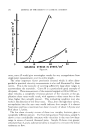
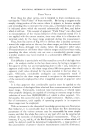
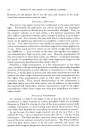
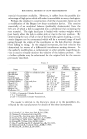
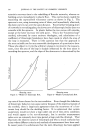
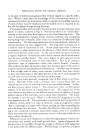
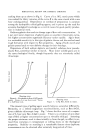
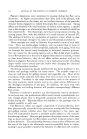
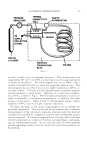
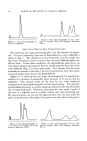
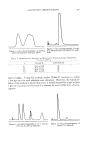
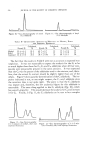
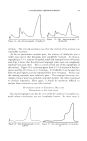
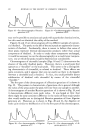
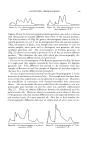
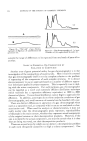
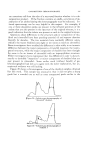
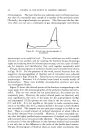
GAS-PARTITION CHROMATOGRAPHY 317 PRESSURE REGULATOR TO SAMPLE COLLECTION SYSTEM I I.IELIUM CYLINDER THERMAL SAMPLE CONDUCTIVITY NTRODUCTION CELL REFERENCE SENSING CONSTANT TEMPERATURE BATH COLUMN Figure 1. pounds: methyl, ethyl and isopropyl benzoates. Their boiling points are respectively, 199 ø, 212 ø and 218øC., so that they cannot be separated nearly so cleanly by distillation. 'Fhis chromatogram was run at 190øC. with a column of crushed fire brick on which was suspended Apiezon wax. The chromatogram shown in Fig. 4 was rur• at a higher temperature, 228øC., on the same column. The ethyl and the isopropyl peaks are pushed together and the resolution is much poorer. Operation at a much lower tempera- ture, 167øC., is shown in Fig. 5. Here the peaks are spread out and are not nearly so amenable to quantitative interpretation in addition, the whole process is much slower. Figure 6 shows a chromatogram using a column material at 190øC. that did not give as good a separation. Of course, the peaks in the various chromatograms do not identify the particular compounds. They can be used for this purpose only if reference chromatograms of the individual compounds obtained under the identical conditions are available for comparison, and even then considerable caution must be exercised. If unknown compounds are involved, there is obvious need for complementary analysis of fractions corresponding to each peak, e.g., by infrared spectroscopy. In any case, the type of column packing and the operating condit}op.s must be chosen with care if best results are to be obtained.

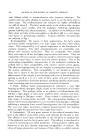
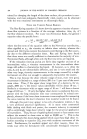
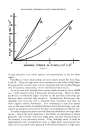
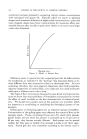
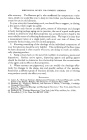
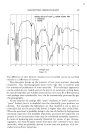
318 JOURNAL OF THE SOCIETY OF COSMETIC CHEMISTS Figure 2.--Gas chromatography of octvl (Cs) aidehyde. Figure &--Gas chromatography of 1:1:1 mix- ture of methyl, ethyl and isopropyl benzoates 190øC. ANALYTICAL USES or GAS CHROMATOGRAPHY One important use of gas chromatography is for the detection of impuri- ties. Its use in detecting 1 per cent of heptaldehyde in octyl aldehyde is shown in Fig. 7. The sensitivity of the instrument and the sample size have been increased to such an extent that the octyl aldehyde peak runs off the chart. Under these conditions, the heptaldehyde peak shows up very clearly between the peaks for the very small impurities that were in the octyl aldehyde (Fig. 2) and the major peak. It is obvious that the latter materials are present in less than 1 per cent concentration since their peaks are much smaller than that of the heptaldehyde. Figures 8-11 illustrate the use of gas chromatography for quantitative analysis of a mixture of supposedly equal amounts of C7, Cs, C9 and aldehydes. This analysis could not be done by any other analytical technique with the possible exception of mass spectroscopy. The quantity of each aldehyde present is, strictly speaking, represented by the area under the corresponding peak. However, estimating the area under a peak of this sort in a rigorous way is a rather tedious and time-consuming job. For most purposes, one can use the approximation that the area under the peak is proportional to the height of the peak times the width of the peak at Figure 4.--Gas chromatography of 1:1:1 mixture of methyl, ethyl and isopropyl benzoates 228øC. Figure 5.--Gas chromatography of 1:1:1 mix- ture of methyl, ethyl and isopropyl benzoates 167 ø C.
Purchased for the exclusive use of nofirst nolast (unknown)
From: SCC Media Library & Resource Center (library.scconline.org)